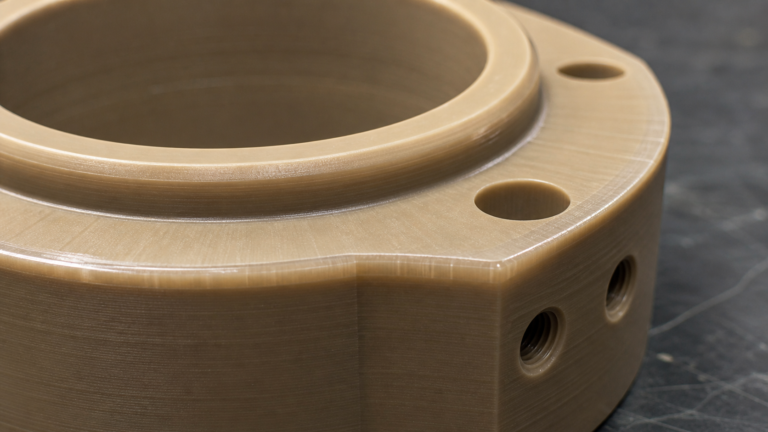
Long-Term Deformation in Polymer Supports: Defining the Real Limit?
Your polymer support seems perfect for the job, but will it hold its shape over time? This subtle change can lead to critical failure, and datasheets don't tell the whole story.
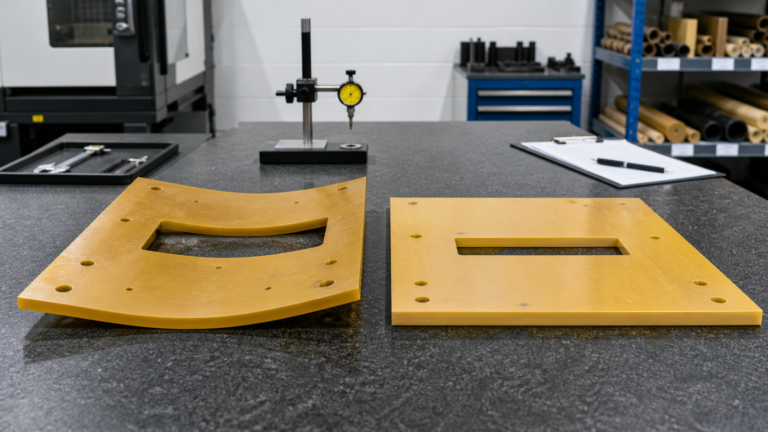
The real performance limit of a polymer support is defined by its functional fit, not just its material name. We determine this by translating application needs into a maximum allowable movement, then tracking displacement under simulated service loads to set a data-driven, evidence-based deformation limit.
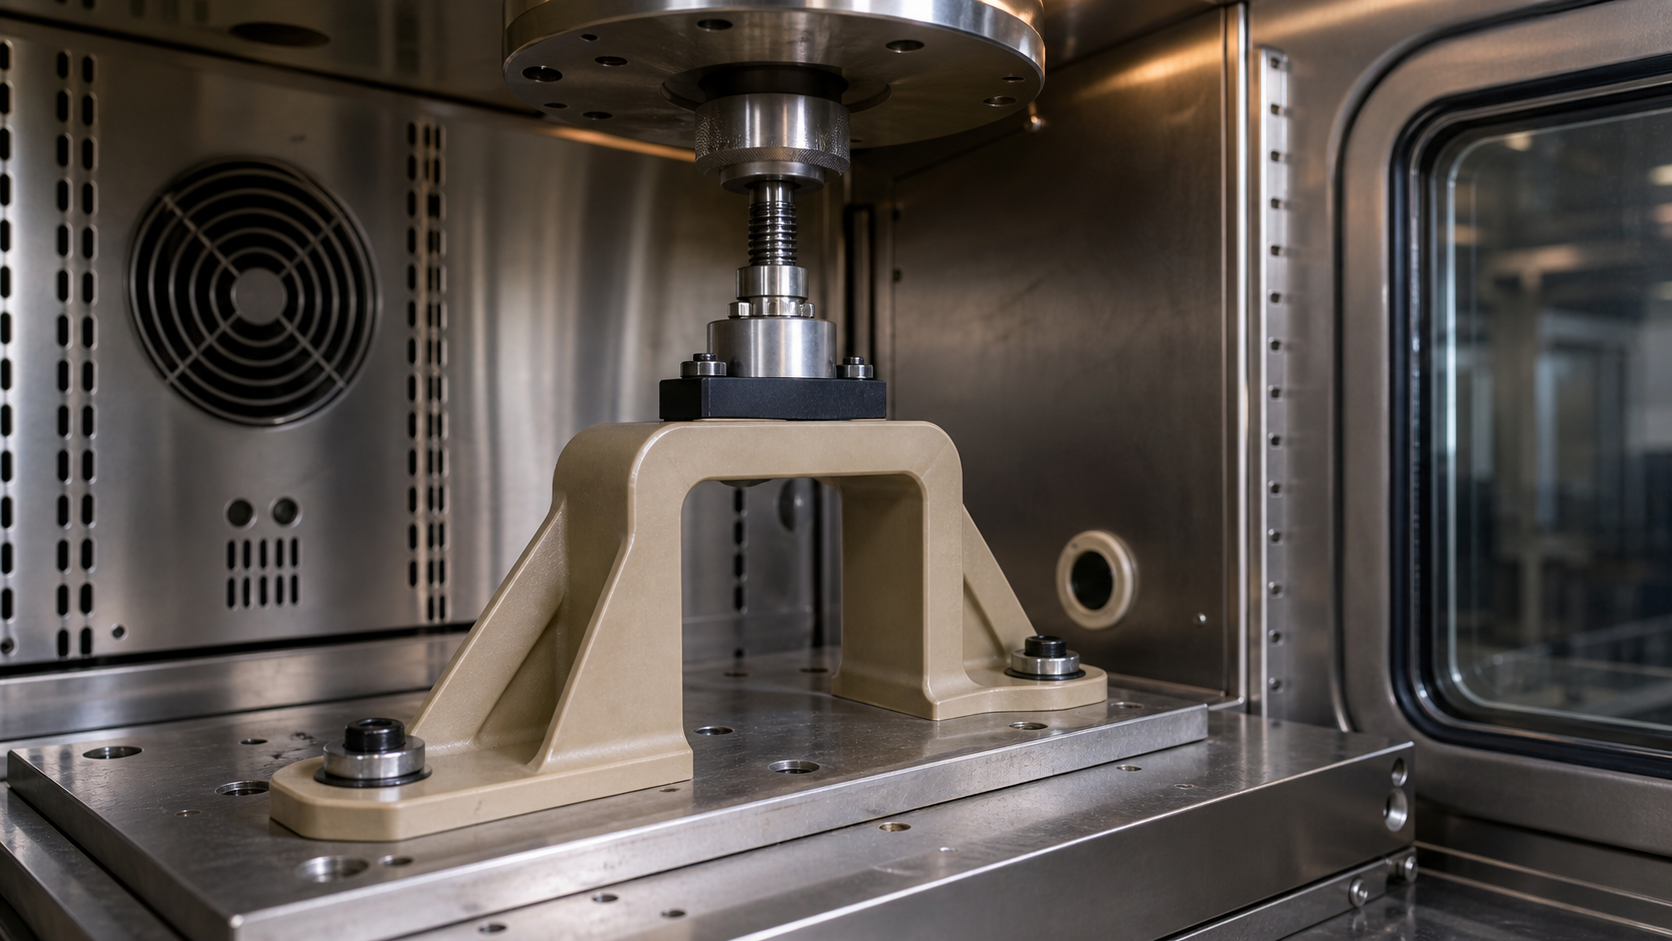
When I talk to engineers about long-term part performance, the conversation often starts with a polymer name, like PEEK or PEI. The assumption is that a high-performance material is inherently stable. But stability isn't a simple yes-or-no property. All polymers deform under load over time, a process we know as creep. The real question isn't if it will deform, but how much it will deform and when that deformation becomes a problem for your specific application.
Simply choosing a material from a datasheet is only the first step. To truly understand the service life of a component, we need to dig deeper. We have to connect the material's behavior—its response to time, temperature, and stress—directly to the functional requirements of the assembly it sits in. This process moves us from relying on a brand name to making an informed engineering decision based on evidence. Let's walk through how we build that evidence.
Translating Functional Fit Into Allowable Movement?
A component works perfectly until it doesn't. But what's the actual tipping point? It's not a material property, but a functional one that you must define for your design.
This involves analyzing the component within its assembly to determine the maximum physical displacement it can tolerate before causing misalignment, loss of clamping force, or interference with other parts. This translates a functional requirement into a specific, measurable number.
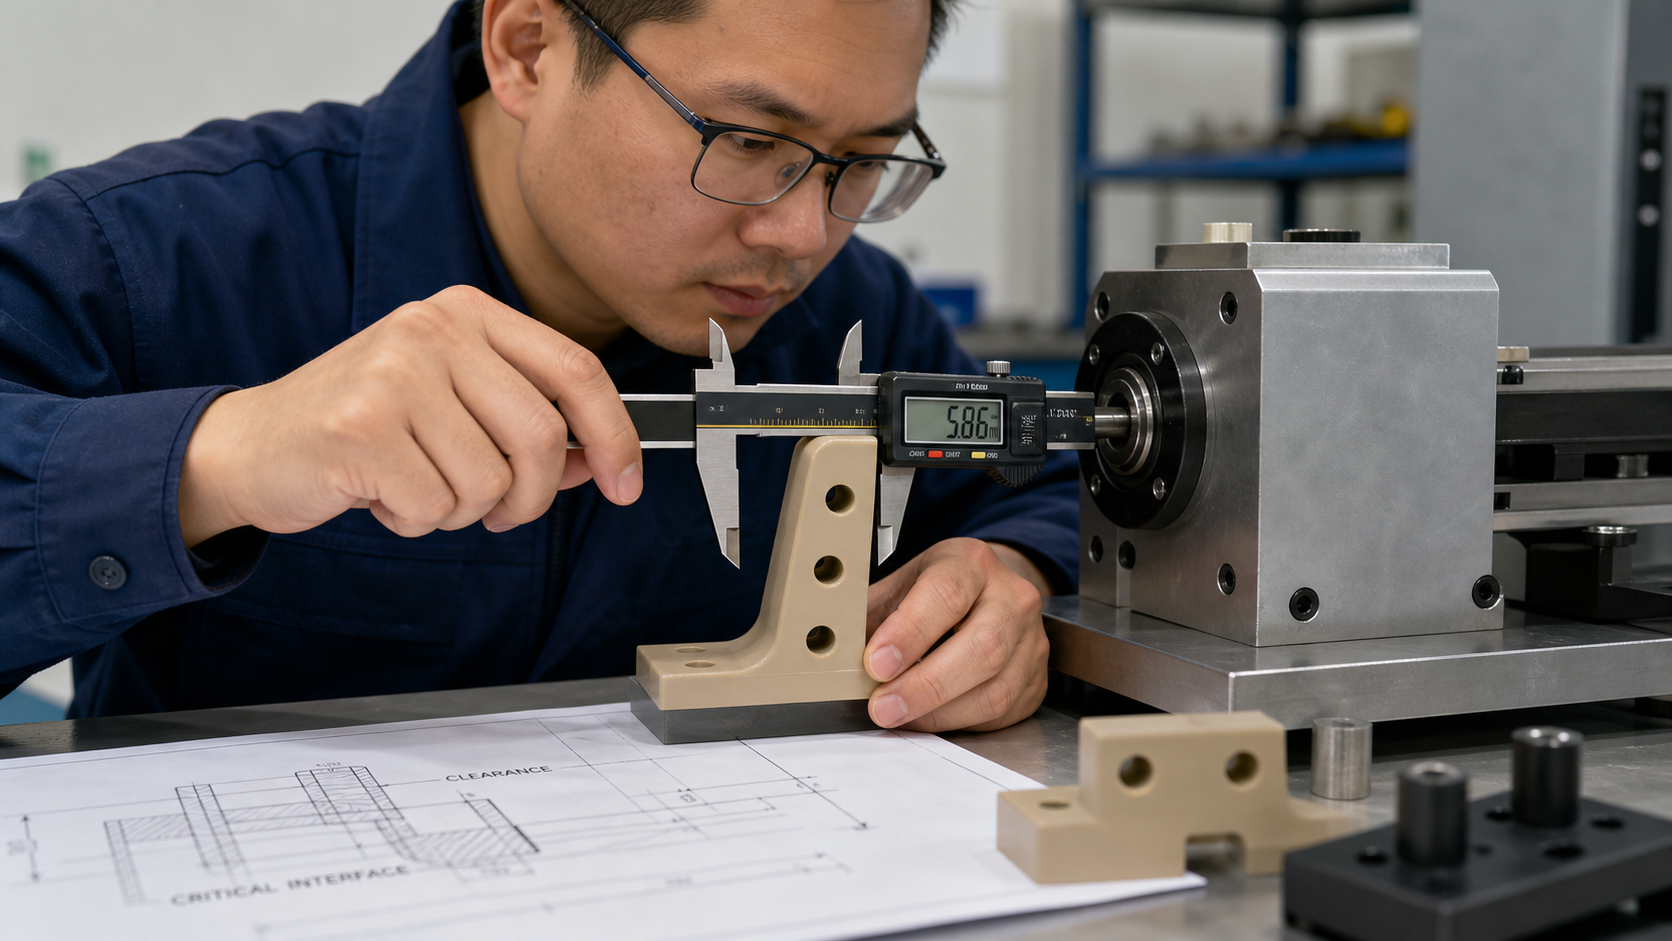
The first step is always to look away from the material and focus entirely on the job the part has to do. A support bracket for a delicate optical sensor has a completely different definition of "failure" than a structural support in a piece of industrial machinery. In my experience, this is the most critical conversation to have. We need to ask questions that connect the part's shape to its function. For example, if a support sags, what does it touch? If a bolted joint relaxes, does the seal leak? The answers to these questions give us a physical dimension of failure.
Defining the Movement Threshold
We can't just guess at this. We have to quantify it. We look at the engineering drawings of the entire assembly. We identify the critical interfaces and clearances. This process helps us build a table of functional limits, turning abstract ideas into hard numbers.
| Functional Requirement | Potential Failure Mode | Critical Dimension to Measure | Allowable Movement (mm) |
|---|---|---|---|
| Maintain alignment of a sensor | Sensor points in the wrong direction | Vertical sag at component end | < 0.25 mm |
| Hold a seal compressed | Fluid leak due to pressure loss | Change in component thickness (relaxation) | < 0.10 mm |
| Keep a moving part clear | Interference or mechanical binding | Gap between support and moving arm | > 0.50 mm (must maintain gap) |
From Function to a Number
By going through this exercise, we establish a clear acceptance criterion. We now have a number—our Allowable Movement limit. This isn't a material property found on a datasheet. It is a design-specific limit derived from the application's unique needs. This number becomes the finish line for our analysis. Any deformation beyond this point is considered a functional failure, regardless of what the material is made of.
Recording the Support's Load History?
You know the maximum load on your component, but is that the full story? Real-world conditions are rarely that simple, with temperature and load cycles adding significant stress over time.
Recording the load history means documenting the full range of mechanical and thermal stresses the part will see. This includes the magnitude and duration of static loads, any cyclic stresses, and the complete operating temperature profile, as heat dramatically accelerates deformation.
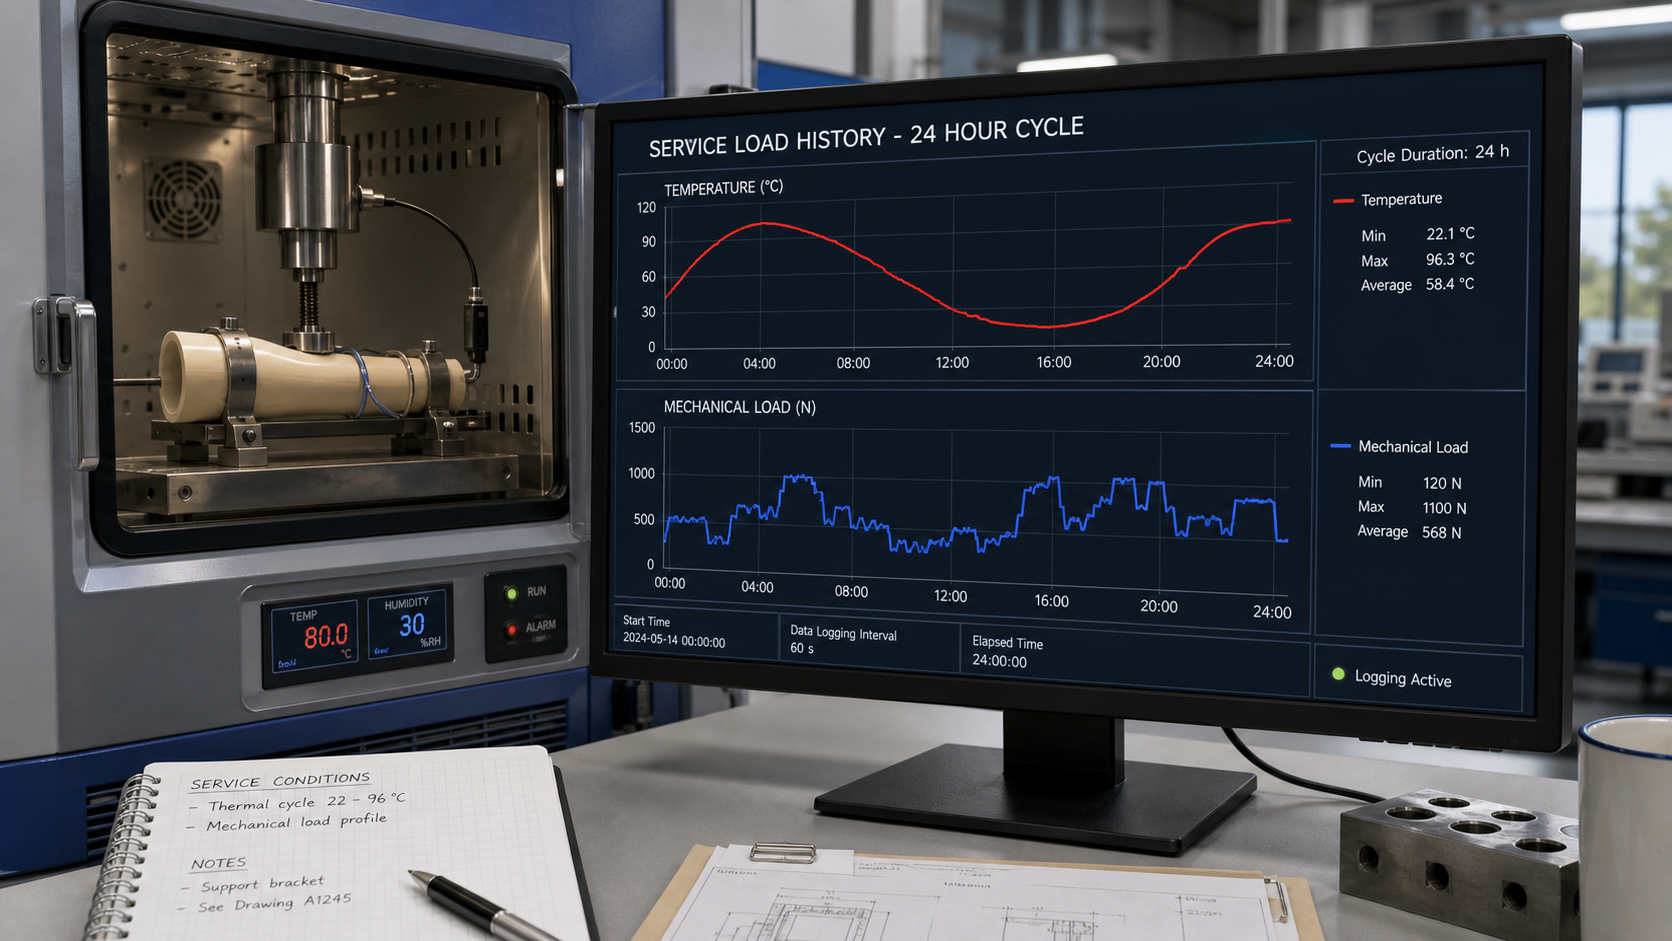
Once we know how much the part can move, we need to figure out what forces will make it move. A simple static load at room temperature is the easiest case, but it's rarely the reality. In most of the demanding applications we support, parts experience a complex mix of mechanical loads and temperature changes. Both factors drive long-term deformation, so we must account for them.
We work with clients to build a complete picture of the service environment. This isn't just about the peak load. It's about duration. A heavy load applied for one minute has a very different effect than a light load applied for five years. It's also about temperature. For polymers, temperature is an energy input that gives the molecular chains more mobility, making it easier for them to slide past one another under load. This is why creep and stress relaxation happen much faster at elevated temperatures, even when those temperatures are well below the material's heat deflection temperature. We have to consider constant high temperatures, but also temperature cycles, which can introduce their own expansion and contraction stresses. This detailed load and temperature history becomes the script for our service simulation.
Measuring Displacement Throughout the Service Simulation?
You can't manage what you can't measure. Guessing how a material will behave over five years is risky, but waiting for a field failure is not an option for our clients.
We measure displacement by setting up a controlled test that replicates the component's load and thermal history. Using precise instruments like laser sensors or dial indicators, we continuously track the physical deformation of the part over time to create a performance curve.
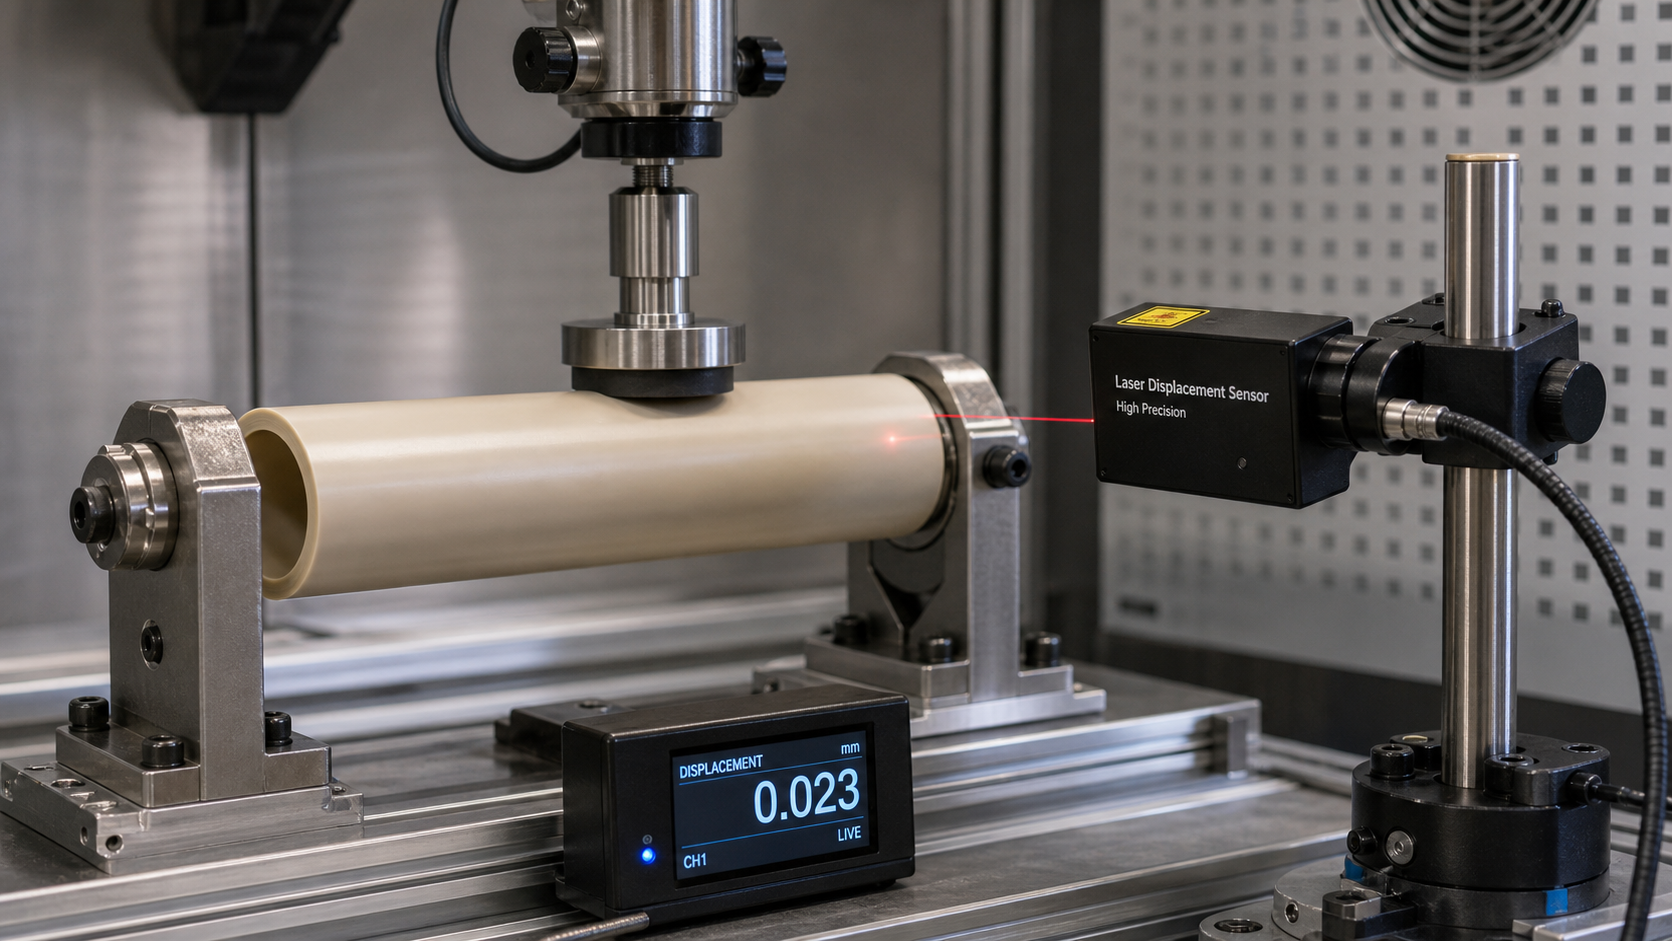
This is where we connect the load history to the material's actual behavior. The goal is to simulate the component's life in a controlled, and often accelerated, way. It’s important to state that we do not present this as our own test evidence. Instead, we help clients interpret existing material supplier data or set up evaluations based on the original grade, test conditions, and their specific application limits.
The setup must be stable and precise. The component is mounted in a fixture that applies the load defined in the load history. This could be a constant weight for a simple creep test or a more complex actuator for cyclic loads. The entire setup is often placed inside a thermal chamber to replicate the operating temperature profile. Then, we use a non-contact measurement device, like a laser sensor, to track the part's movement. We record displacement readings at regular intervals. This data starts to build a curve, showing us how the deformation progresses over time. Initially, the movement might be faster, then it settles into a slower, steady rate. This curve is the key piece of evidence we need to predict the component's long-term future.
Choosing an End-of-Life Deformation Limit?
You have all the data: how much the part can move and how much it is moving over time. How do you make the final call and define the component's true service life?
The end-of-life limit is chosen by overlaying the "Allowable Movement" threshold (from our functional fit analysis) onto the measured displacement curve from the service simulation. The point where the deformation curve is projected to cross this limit defines the component's functional service life.
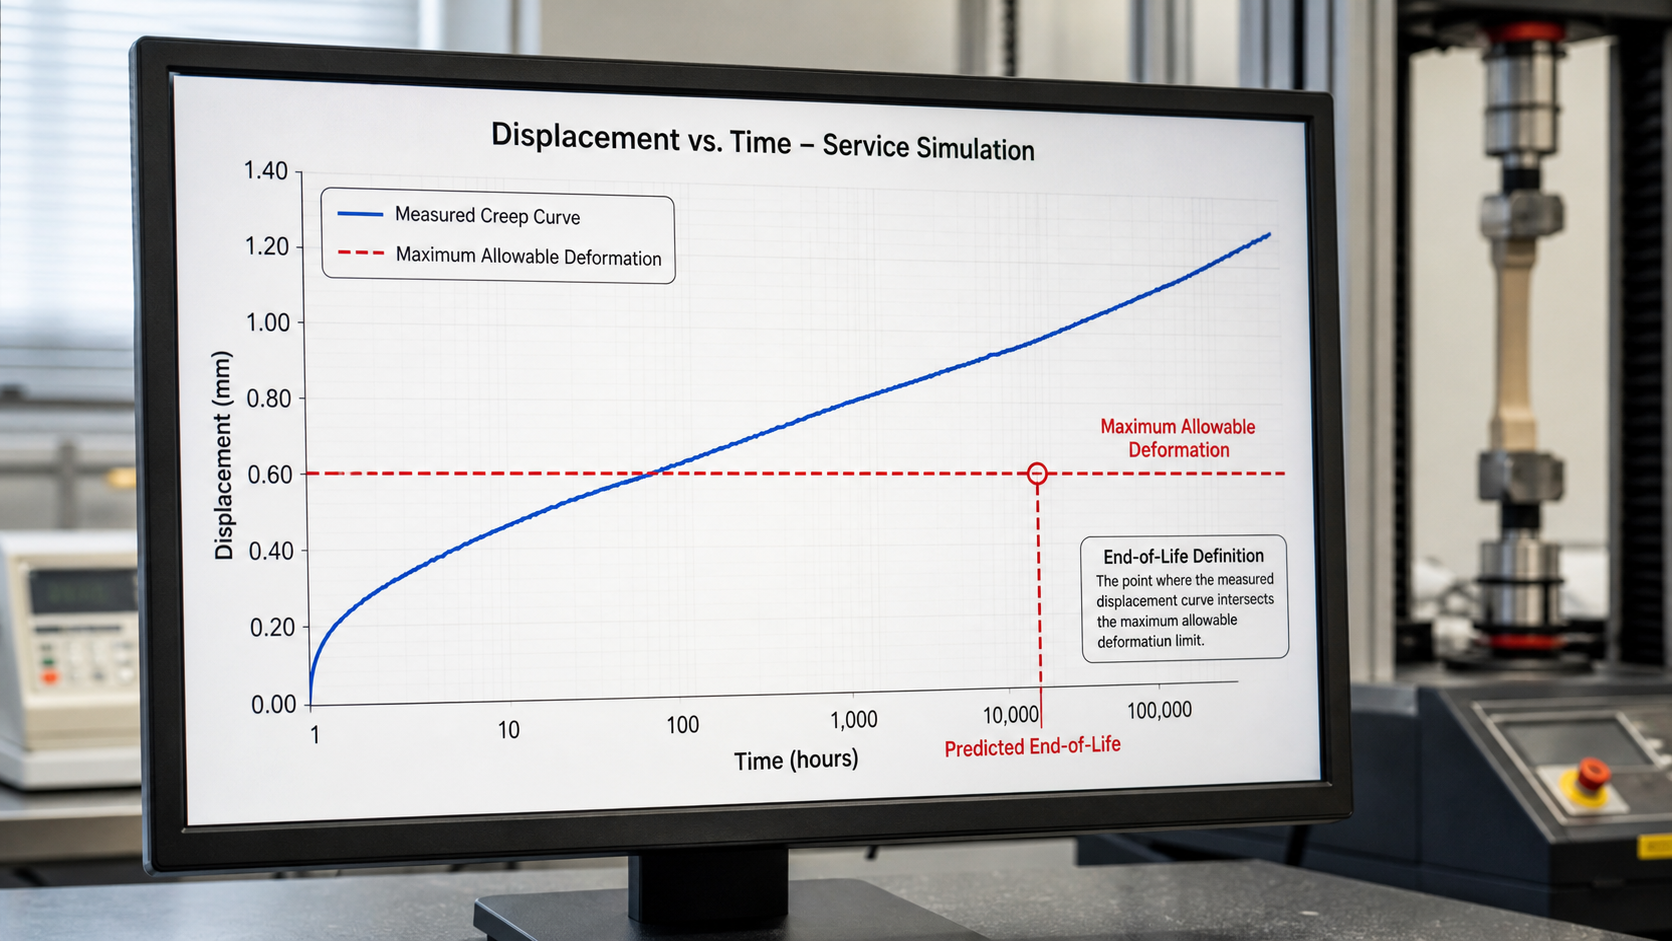
This is the final step where everything comes together. We take the "Allowable Movement" number we defined in the very first step. This number becomes a horizontal line on our displacement-versus-time graph. This line represents the failure threshold for the application. It’s no longer an arbitrary guess; it's an evidence-based limit directly tied to the functional needs of the design.
We then plot the displacement data we collected during the simulation. By projecting this curve forward, we can predict when the component will reach the allowable movement limit. This gives us a realistic, data-driven estimate of the part's functional service life under its specific operating conditions. We can then add a safety factor to this estimate to provide a comfortable margin of error. This entire process—from function to measurement to a final limit—is what gives us real confidence in a component's long-term performance. It moves the decision away from a simple material choice and turns it into a proper engineering analysis. It’s a more rigorous approach, but for critical applications, it’s the only way to ensure reliability.
Conclusion
Defining a true deformation limit connects functional needs with measured performance. This evidence-based approach provides genuine confidence in a polymer component's long-term reliability, moving beyond assumptions based on material names alone.