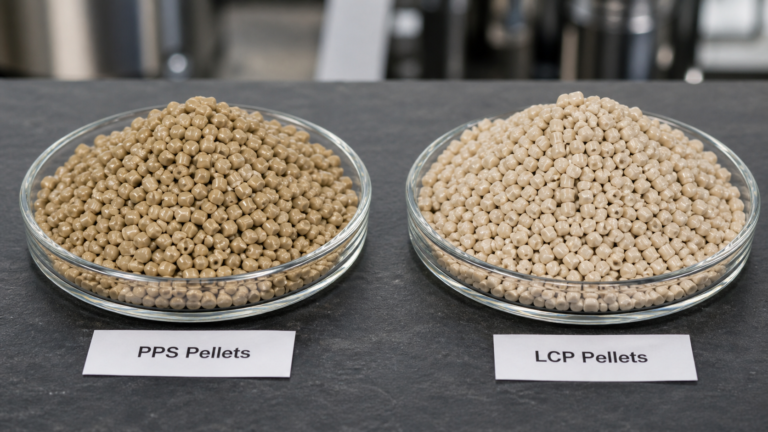
Does Beige PEEK Automatically Mean Adequate Crystallinity?
Your PEEK component arrived, and it has that classic beige color. But can you be sure it has the mechanical properties you need? An under-crystallized part can fail unexpectedly.
No, a beige appearance alone does not guarantee adequate PEEK crystallinity. While color indicates a semi-crystalline state, it is not a quantitative measurement. True verification requires analytical methods like Differential Scanning Calorimetry (DSC) to measure the actual degree of crystallinity and ensure performance.
I've seen many projects where a part looks perfect on the outside but fails to meet the demands of its application. The color of PEEK is a useful first check, but it's only the beginning of the story. The real evidence lies deeper, within the polymer's molecular structure, which is shaped by its cooling history. Relying only on appearance can be a costly mistake. We need to look past the surface and use the right tools to confirm that the material's internal morphology can deliver the performance required. Let’s explore how to make quality-release criteria an evidence-based decision.
Separating Beige Appearance From a Crystallinity Measurement?
You're worried that a simple visual check isn't enough to release a critical PEEK part. How do you move from a subjective color assessment to an objective, data-driven decision?
Separate appearance from measurement by treating color as a preliminary indicator, not a final acceptance criterion. Use a quantitative method like DSC to measure the percentage of crystallinity. This provides an objective value that can be directly correlated with mechanical performance and processing history.

When PEEK cools slowly from its molten state, its polymer chains have time to organize into ordered, crystalline structures. This semi-crystalline state is what gives the material its characteristic opaque, beige appearance and its excellent mechanical and chemical resistance properties. If cooled too quickly (quenched), the chains are frozen in a disordered, amorphous state, resulting in a transparent, amber-colored material. While this is a clear distinction, the reality is more nuanced. There are many shades of "beige," and the human eye cannot reliably translate a specific shade into a specific degree of crystallinity. We use color as a basic check, but we never use it for final approval on critical components. The real work involves getting a number.
Visual Clues vs. Quantitative Data
Here’s how we think about the difference between what we see and what we measure.
| Assessment Method | What It Tells You | Limitations |
|---|---|---|
| Visual Appearance (Color) | Indicates whether the PEEK is generally amorphous (amber) or semi-crystalline (beige). A very light or dark color might suggest a process deviation. | Highly subjective and non-quantitative. Cannot determine the exact degree of crystallinity (e.g., 25% vs. 35%). Lighting conditions can affect perception. |
| DSC Measurement | Provides a precise, numerical value for the percent crystallinity by measuring the heat absorbed during melting (heat of fusion). | The result is only representative of the small sample tested. Requires proper sampling from critical areas of the part. The test method itself must be consistent. |
Ultimately, we view the cooling history and tool temperature during processing as the key drivers of PEEK crystallinity. Visual appearance is a result of that process, but DSC analysis gives us the hard data needed to make an evidence-based decision for quality release.
Sampling the Core as Well as the Surface?
You've approved a PEEK component based on its surface appearance and a single test sample. But what if the properties in the middle of the part are completely different?
You must sample the core in addition to the surface for thick-section parts. The surface cools much faster than the core, leading to a "skin effect" with higher crystallinity on the outside and potentially lower, under-developed crystallinity on the inside. This hidden weakness can cause unexpected failure.
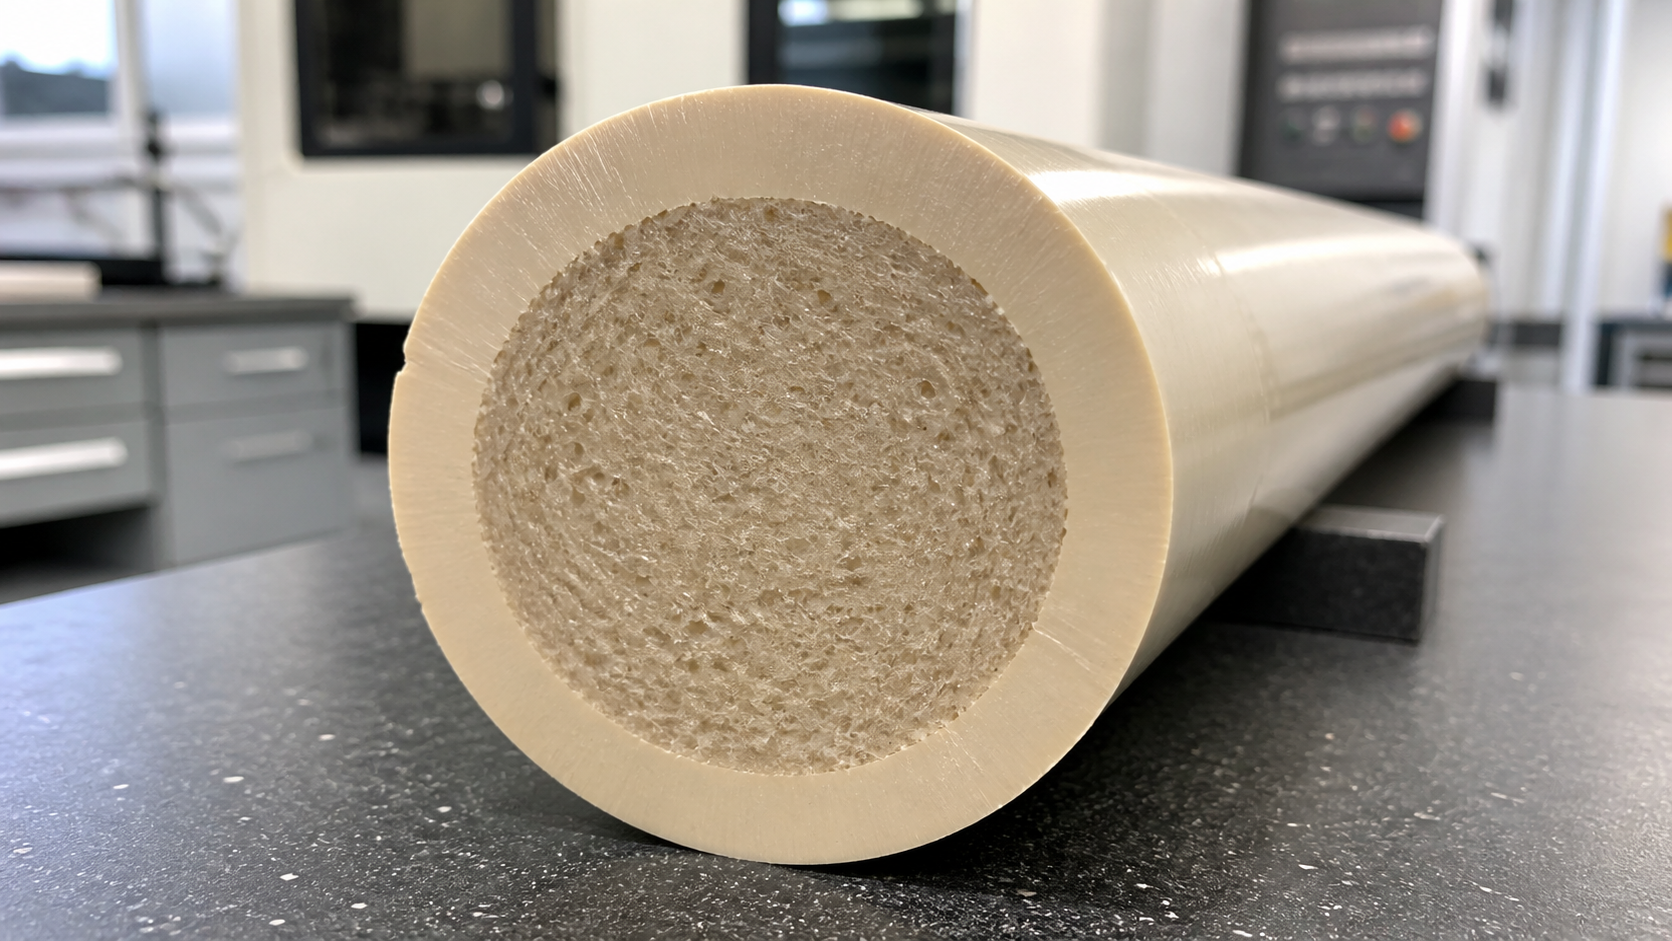
I remember a project involving a large PEEK isolator. The outer surface was a perfect beige, and the initial DSC sample, taken from a machined edge, passed with a crystallinity of 33%. However, when the customer started machining deep features into the component, they noticed changes in chip formation and tool wear. We recommended taking a sample from the very center of a sacrificial part. The result was surprising but educational: the core crystallinity was only 24%. The slow heat dissipation from the center of the thick stock shape had not allowed for full crystal growth. This gradient in morphology meant the mechanical properties were not uniform throughout the part. For any PEEK component with a cross-section thicker than a few millimeters, assuming uniform properties is a risk. We always advise our partners to consider the thermal mass of the part and establish a sampling plan that provides a true picture of the entire component, not just its skin.
Checking the DSC Method Behind the Report?
You received a test report showing the PEEK crystallinity is within spec. But do you know if the test method used was appropriate? An incorrect test setup can produce misleading results.
Always check the DSC method details, including the heating rate and how the ideal heat of fusion (ΔH°f) was determined. Different standards and heating rates can yield slightly different results. For consistency, ensure the same validated method is used for all batch-to-batch comparisons.

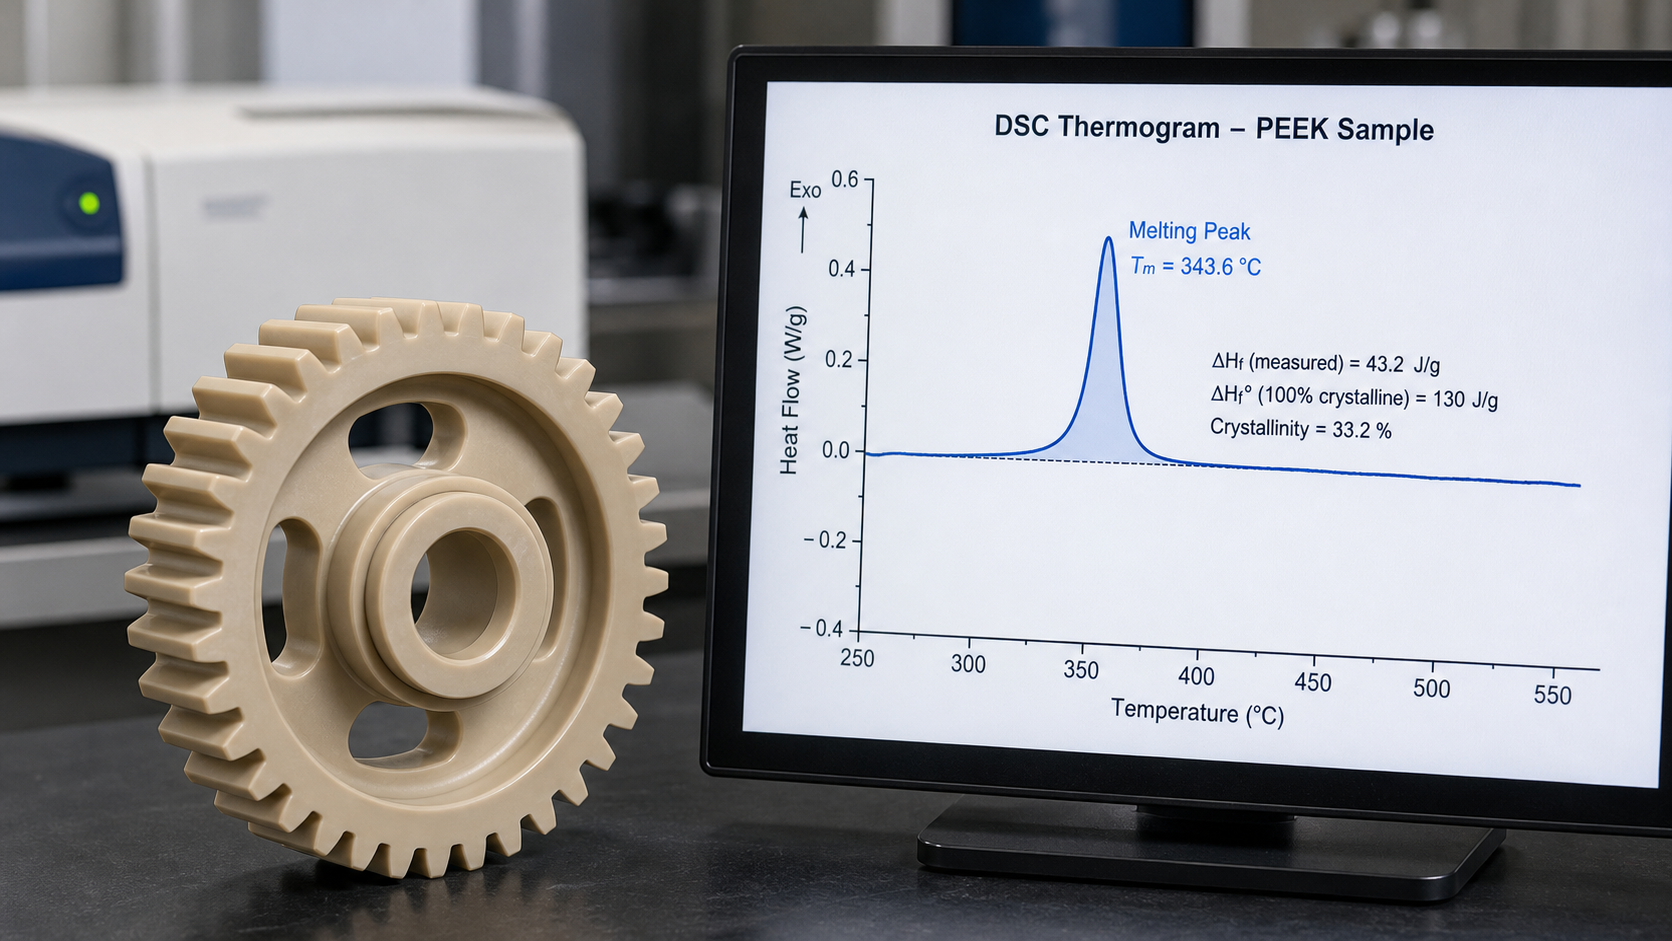
A DSC report is more than just a final number. The "how" is just as important as the "what." Differential Scanning Calorimetry works by measuring the energy needed to heat a sample compared to a reference. When the PEEK sample melts, it absorbs extra energy, creating a peak on the thermogram. The area of this peak is the heat of fusion (ΔH_f), which is then compared to the theoretical heat of fusion for 100% crystalline PEEK (ΔH°f) to calculate the percent crystallinity. The value used for ΔH°f can vary slightly in literature (often cited as 130 J/g), so it's critical to know which reference value the lab is using. Furthermore, the heating rate (e.g., 10°C/min vs. 20°C/min) can affect the shape and position of the melting peak. When we review a supplier's documentation, we don't just look at the result. We examine the test conditions to ensure they are consistent and relevant. This helps us retain the original grade's specifications and make fair comparisons, rather than presenting it as our own test evidence.
Combining Structural Evidence With Functional Release Criteria?
Your PEEK component has a certified crystallinity of 35%. This sounds great, but how do you know if that's actually what your application needs to perform reliably over its lifetime?
Combine structural evidence from DSC with functional release criteria relevant to your application. A specific crystallinity percentage is meaningless until it's linked to a required performance outcome, such as dimensional stability at high temperatures, creep resistance under load, or wear performance.

Crystallinity is a means to an end, not the end itself. The reason we care so much about it is because it directly influences the properties that matter in the real world. Higher crystallinity generally leads to increased stiffness, hardness, wear resistance, chemical resistance, and better long-term stability at elevated temperatures. However, it can also result in slightly lower impact strength. There is no single "best" crystallinity level; the optimal range depends entirely on the application's demands. For a high-load bearing, the goal might be to maximize stiffness and creep resistance. For a seal, chemical resistance and stability might be the priority. We work with our clients to bridge this gap. We help them define quality-release criteria that are evidence-based. This might mean specifying a DSC crystallinity range of 32-38% and requiring that the component shows less than 0.1% dimensional change after a 24-hour thermal soak at its maximum operating temperature. This approach connects a material property to a functional outcome.
Conclusion
Relying on beige color alone is risky. Use DSC, sample correctly, check the method, and link crystallinity data to functional requirements for reliable PEEK components and materials.