Why Can a Strong PPS Grade Fail at Its Weld Line?
Your high-performance PPS part looks perfect, but it snaps under load. You chose a strong grade, so what went wrong? The hidden weakness is often found at the weld line.
A strong PPS grade can fail at its weld line because this is where two molten polymer flow fronts meet. This meeting point creates a zone of poor molecular adhesion, misaligned reinforcing fibers, and inherent stress concentration, significantly reducing its strength compared to the rest of the part.
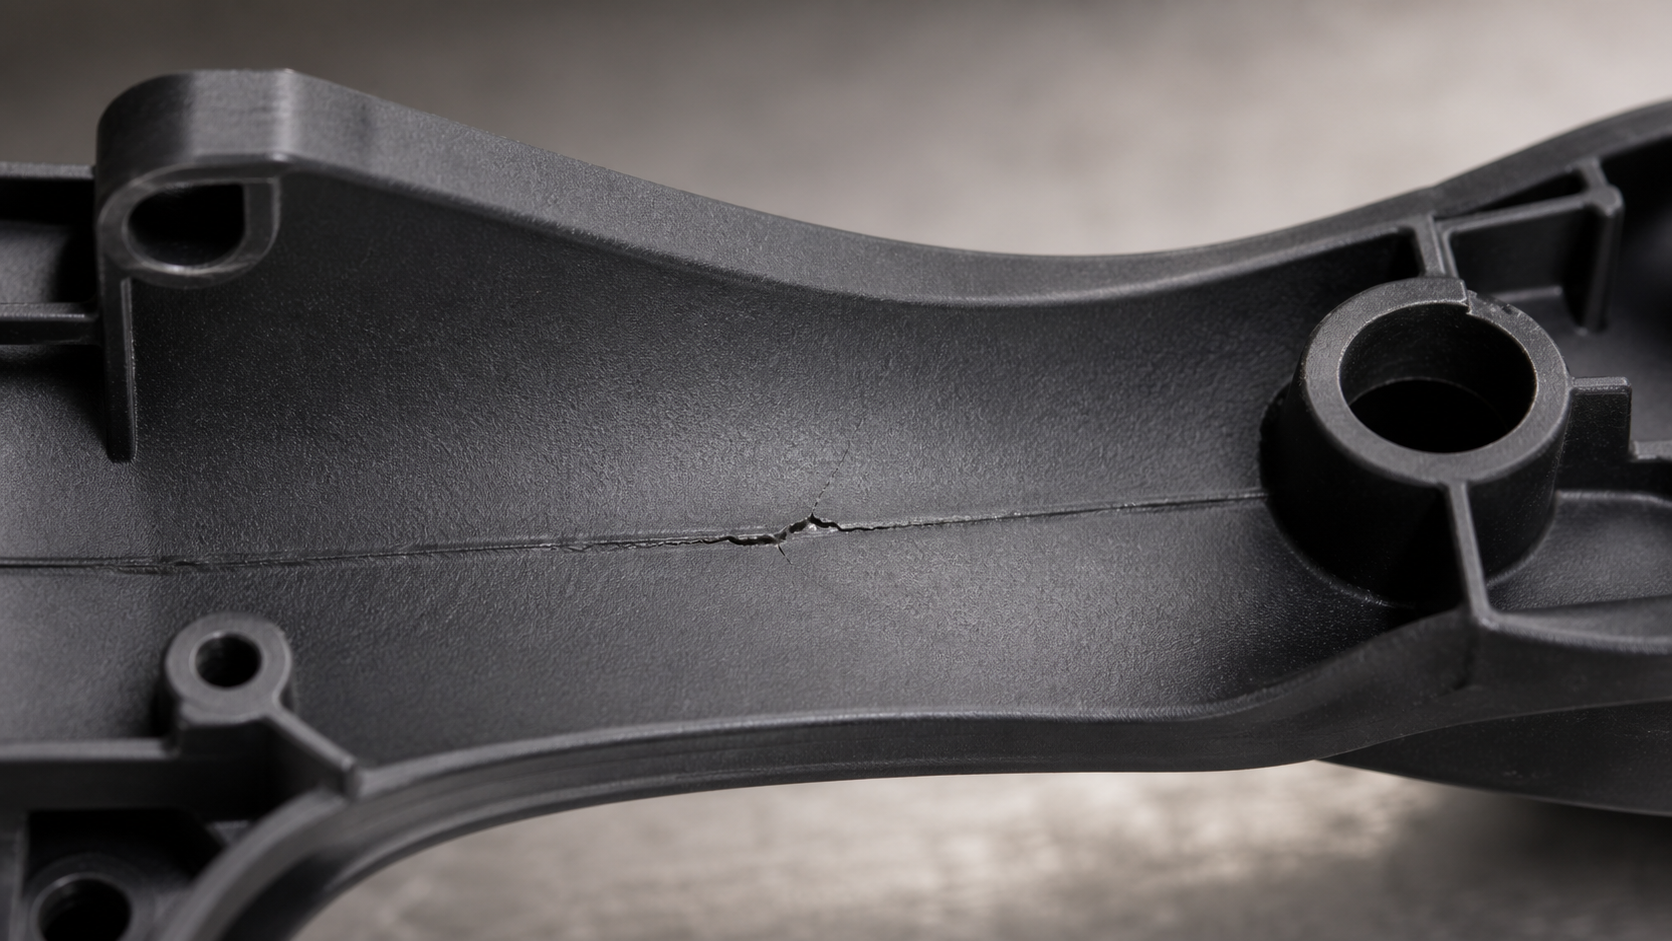
I’ve seen this happen on projects before. A team spends months selecting the perfect, high-strength, glass-filled PPS for a demanding automotive application. The datasheets look great, and the initial prototypes seem fine. But once the parts are in service, they start failing at a fraction of the expected load. The culprit, almost every time, is a weld line that wasn't considered during the design phase. It's a frustrating problem, but it’s one we can predict and design for. Let's dig into how we identify and manage these weak points.
Finding Where Flow Fronts Meet in the PPS Part?
You can’t see the weak spot on your part. A hidden weld line could be a ticking time bomb, leading to unexpected failure. The solution is to predict its location.
To find where flow fronts meet, engineers use injection molding simulation software. This software predicts how the melted PPS polymer fills the mold, clearly showing the locations where separate flows will merge and form weld lines before any physical parts are made.
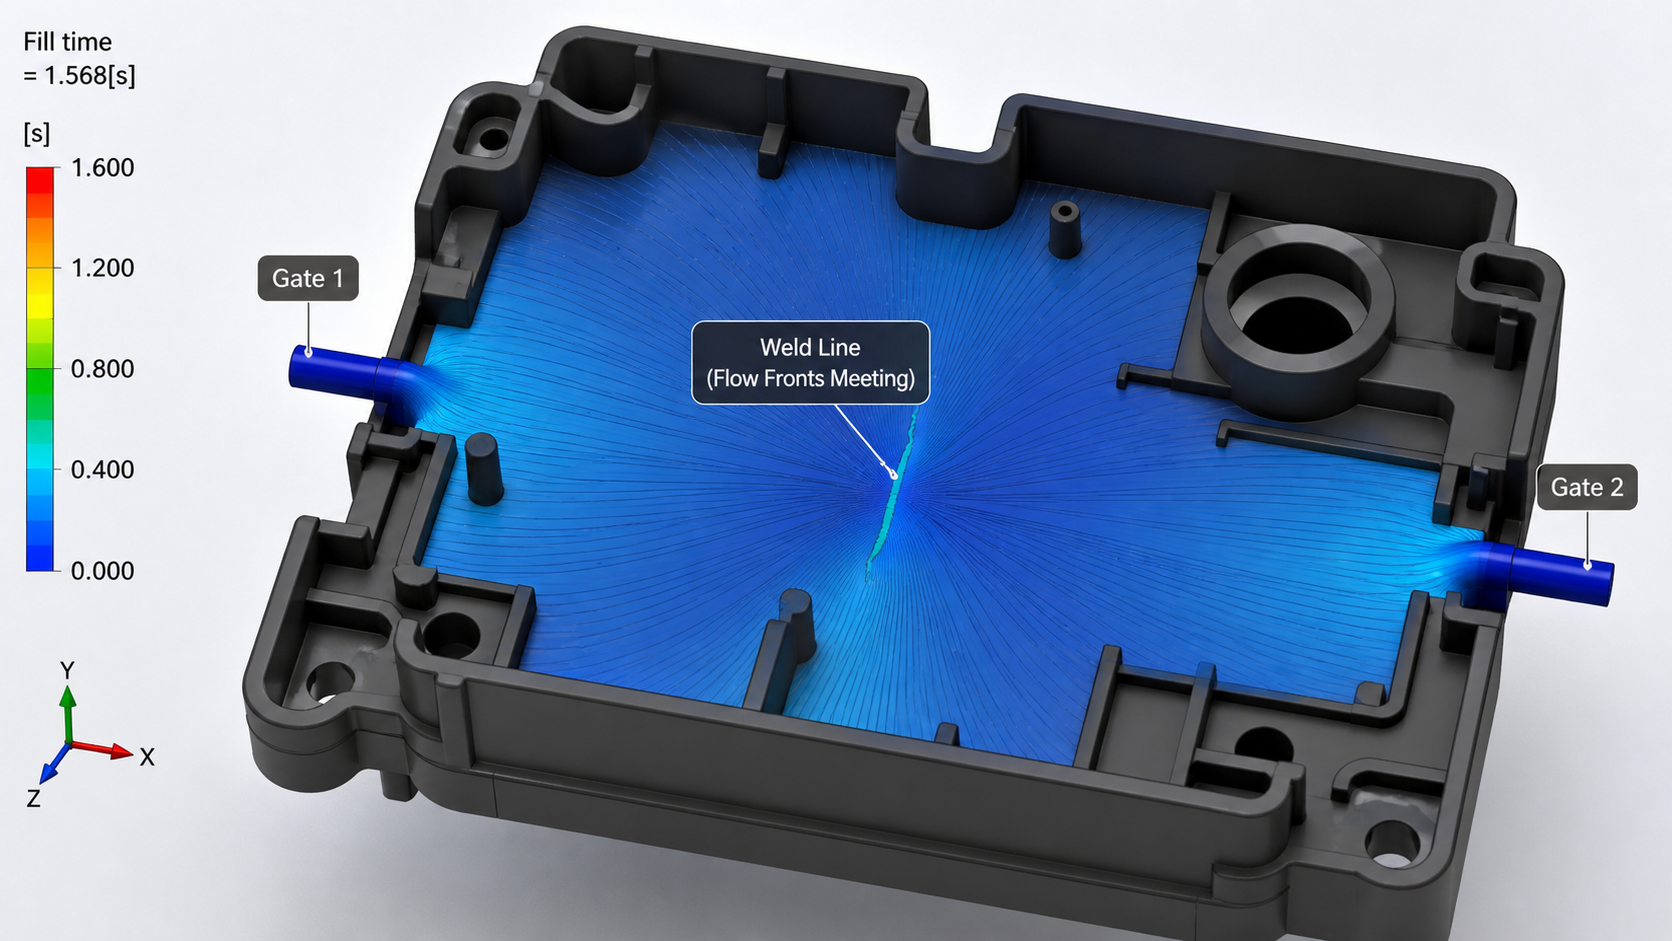
The location of a weld line is not random; it's a direct result of how the part and the mold are designed. Specifically, it depends on where we inject the molten plastic into the mold cavity. We call these injection points "gates." If a part has a complex shape, we often need more than one gate to fill it completely and evenly. When we use multiple gates, the melted PPS flows from each gate and eventually runs into the flow from another. That meeting point is the weld line. I always advise my clients to run a mold-flow analysis early in the design process. This computer simulation shows us a visual map of how the plastic will flow and exactly where weld lines will form. This allows us to adjust the gate locations to move the weld line to a less-stressed area of the part if possible.
The Impact of Gating on Weld Line Formation
The number and position of gates are critical. A simple part might only need one gate, avoiding a weld line altogether. However, for larger or more complex components, that's not always practical.
| Design Factor | Single Gate Design | Multiple Gate Design |
|---|---|---|
| Weld Line Presence | None (typically) | Present where flow fronts meet |
| Part Complexity | Best for simple, smaller parts | Necessary for large, complex parts |
| Potential Weakness | No inherent weld-line weakness | Creates a localized weak area |
| Design Consideration | Focus on flow length and pressure | Must analyze weld line location and strength |
Examining Fibre Alignment at the Meeting Region?
You've found the weld line, but why is it so weak? Ignoring how the reinforcing fibers behave is a major oversight. We must examine how they align at the meeting region.
At a weld line, reinforcing fibers like glass or carbon in the PPS align parallel to the merging flow fronts. This means very few fibers bridge across the weld line, creating a resin-rich, fiber-poor plane that lacks the strength of the base material.
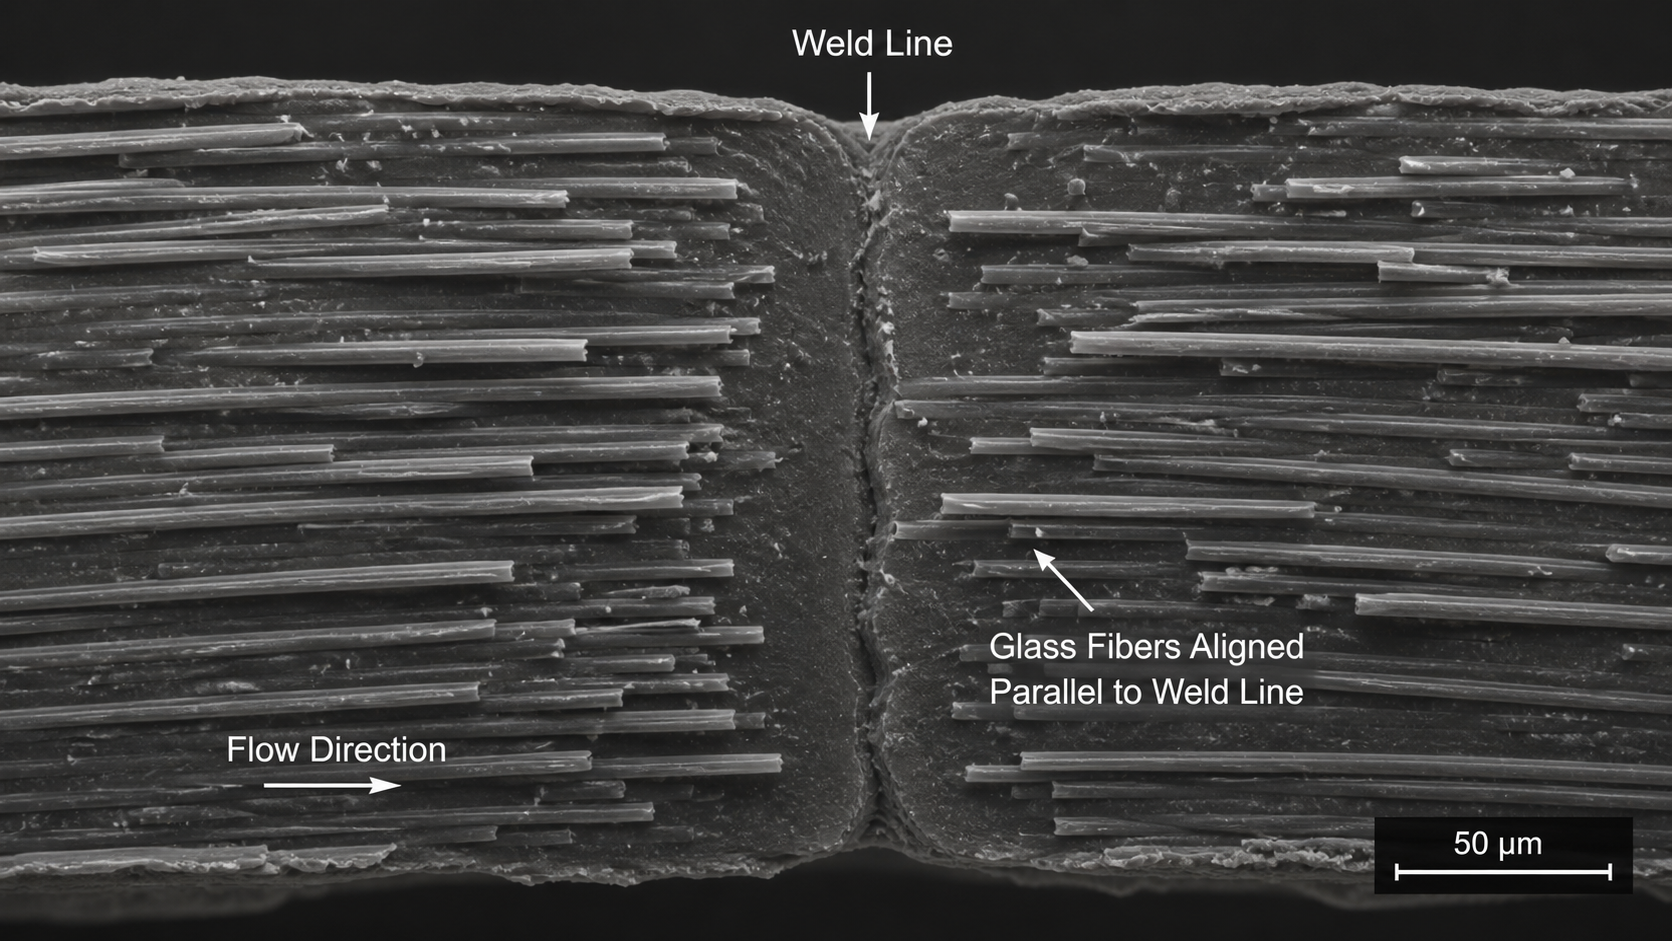
Think of the glass fibers in a reinforced PPS grade like the steel rebar in concrete. They provide the bulk of the strength and stiffness. During injection molding, these fibers tend to align themselves in the direction the plastic is flowing. This is great for the main body of the part, making it very strong along the flow path. However, when two flow fronts meet head-on to form a weld line, a problem occurs. The fibers from both flows arrive at the meeting point and turn to flow alongside it, parallel to the seam. They don't cross over to interlock with the fibers from the other side. This creates a sharp boundary with almost no reinforcement crossing it. It’s like building a concrete wall but stopping all the rebar just before the construction joint. The joint itself is just plain concrete, making it the weakest point. This lack of fiber bridging is the primary reason weld lines can have dramatically lower strength than the datasheet promises.
Testing the Weld Section Under Relevant Loading?
The material datasheet says your PPS is strong. But that number doesn't apply to the weld line. Designing with that value is a gamble that often leads to failure in the real world.
To get a true measure of strength, we perform weld-line tensile testing. This involves molding a special test specimen with a weld line in the middle and pulling it apart. This gives us an evidence-based design allowable specifically for the weakened section.
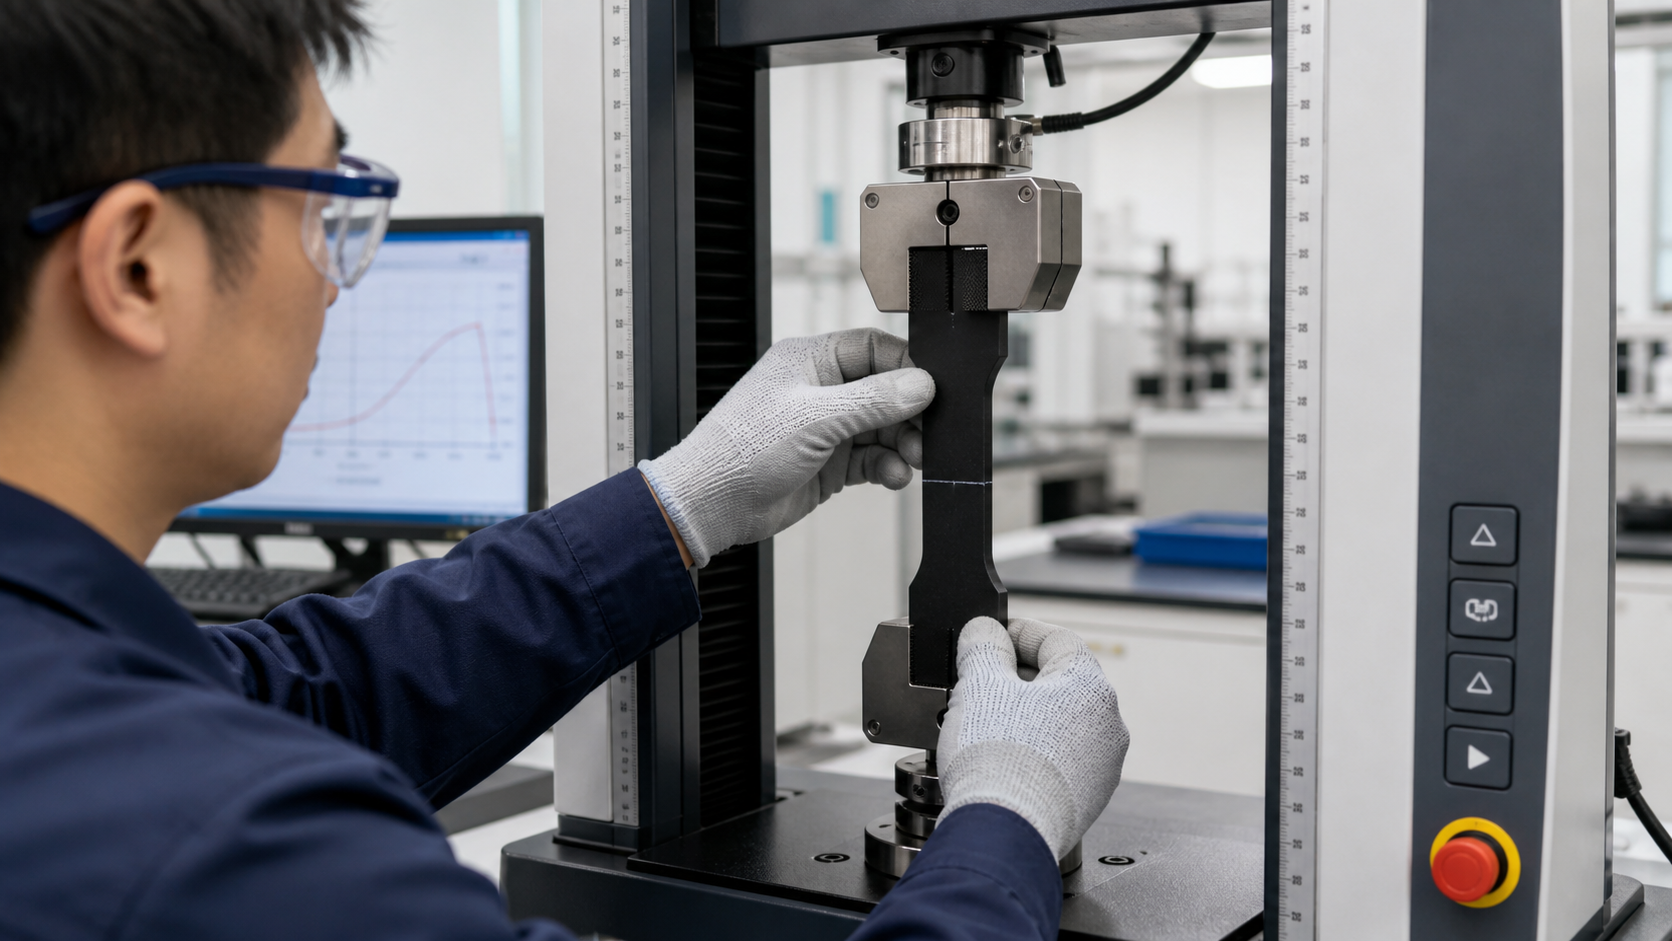
We can't just guess how weak a weld line is. We have to measure it. The standard way to do this is by using a specific mold that has two gates at opposite ends of a tensile bar cavity. When we inject the PPS, two flow fronts travel toward the center and create a perfect weld line right in the middle of the specimen. Then, we take this bar to a tensile testing machine and pull it until it breaks. Unsurprisingly, it always breaks right at the weld line. The force required to break it gives us the actual, practical strength of that weld line for that specific grade and under those processing conditions. I worked on a project where the datasheet listed a tensile strength of 180 MPa. The weld-line tensile test, however, showed a strength of only 75 MPa. That's less than 50% of the listed strength. Without that test, the part would have been severely under-designed.
Interpreting the Test Data
The results from this test are critical. We often talk about "weld line strength retention," which is a percentage comparing the weld line's strength to the material's full strength. This number helps us understand the severity of the strength reduction.
Using Local Strength in the Design Calculation?
You have the weld line test data, but what do you do with it? Applying this new, lower strength value correctly in your design is the final and most critical step.
Use the specific weld-line strength value from testing as the material allowable in your design calculations, like Finite Element Analysis (FEA), but only for that specific region. This evidence-based approach ensures the design accounts for the weakest point in the part.
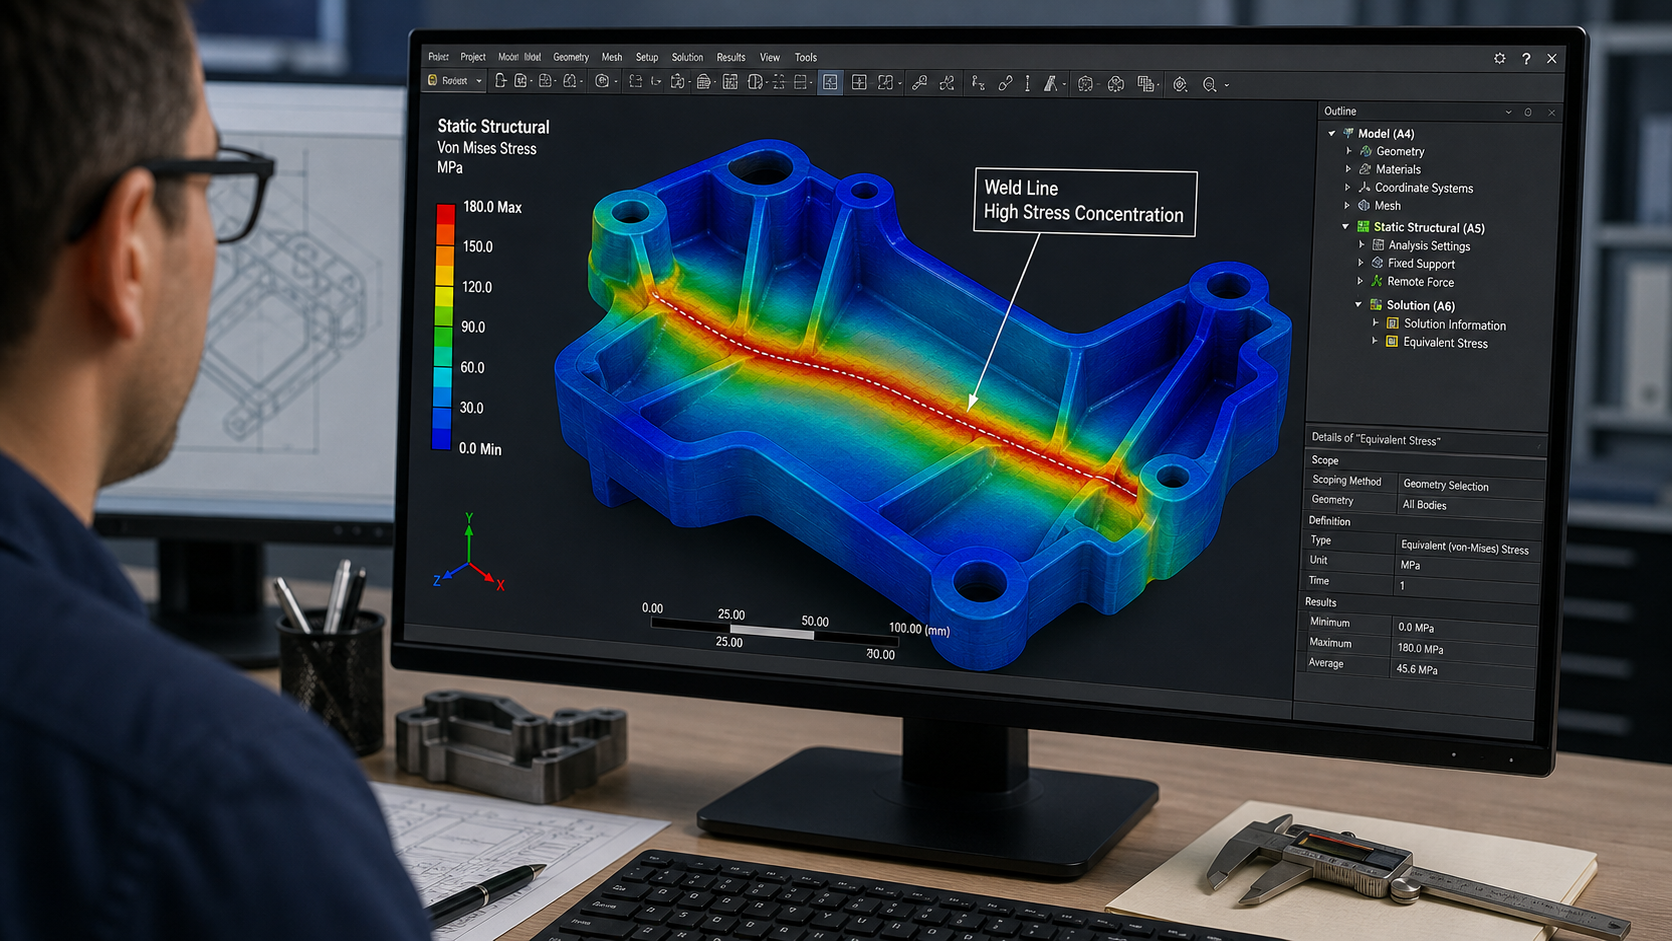
Once we have the actual strength of the weld line, we can build a much safer and more reliable part. Modern design tools like Finite Element Analysis (FEA) are perfect for this. In an FEA model, we can essentially tell the software that most of the part has the high strength listed on the datasheet, but the specific area where the weld line exists has the lower strength we measured from testing. When we simulate the loads the part will see in service, the software will use the correct material property for each location. This gives us a much more accurate prediction of how the part will behave. It shows us if the stress at the weld line will exceed its actual, lower strength, even if the stress in the rest of the part is perfectly safe. This prevents us from being surprised by failures in the field.
A More Realistic Design Approach
This method moves us from a generalized design to a specific, more accurate one. It directly addresses the known weak point instead of ignoring it.
| Design Factor | Datasheet Approach | Weld Line Approach |
|---|---|---|
| Material Strength Used | One high value for the entire part | Local, lower strength at the weld line |
| Predicted Failure Point | May miss the true failure location | Accurately predicts failure at the weld line |
| Safety Factor | Incorrectly high and misleading | Realistic and based on evidence |
| Design Reliability | Lower, prone to unexpected failure | Higher, accounts for the weakest link |
Conclusion
A strong PPS grade is only as strong as its weakest point. Understanding, predicting, and testing weld lines is crucial for creating reliable parts that perform as expected in demanding applications.