How to Improve PPS Part Strength by Optimizing Gate Placement Around a Critical Load Path?
Designing a strong PPS part but worried a weak weld line will cause it to fail? This is a common problem. A simple gate change could prevent costly tool rework.
The best way to place gates is to use mold-flow analysis to move the predicted weld line away from high-stress areas. This makes the final PPS component much stronger and more reliable without changing the material.
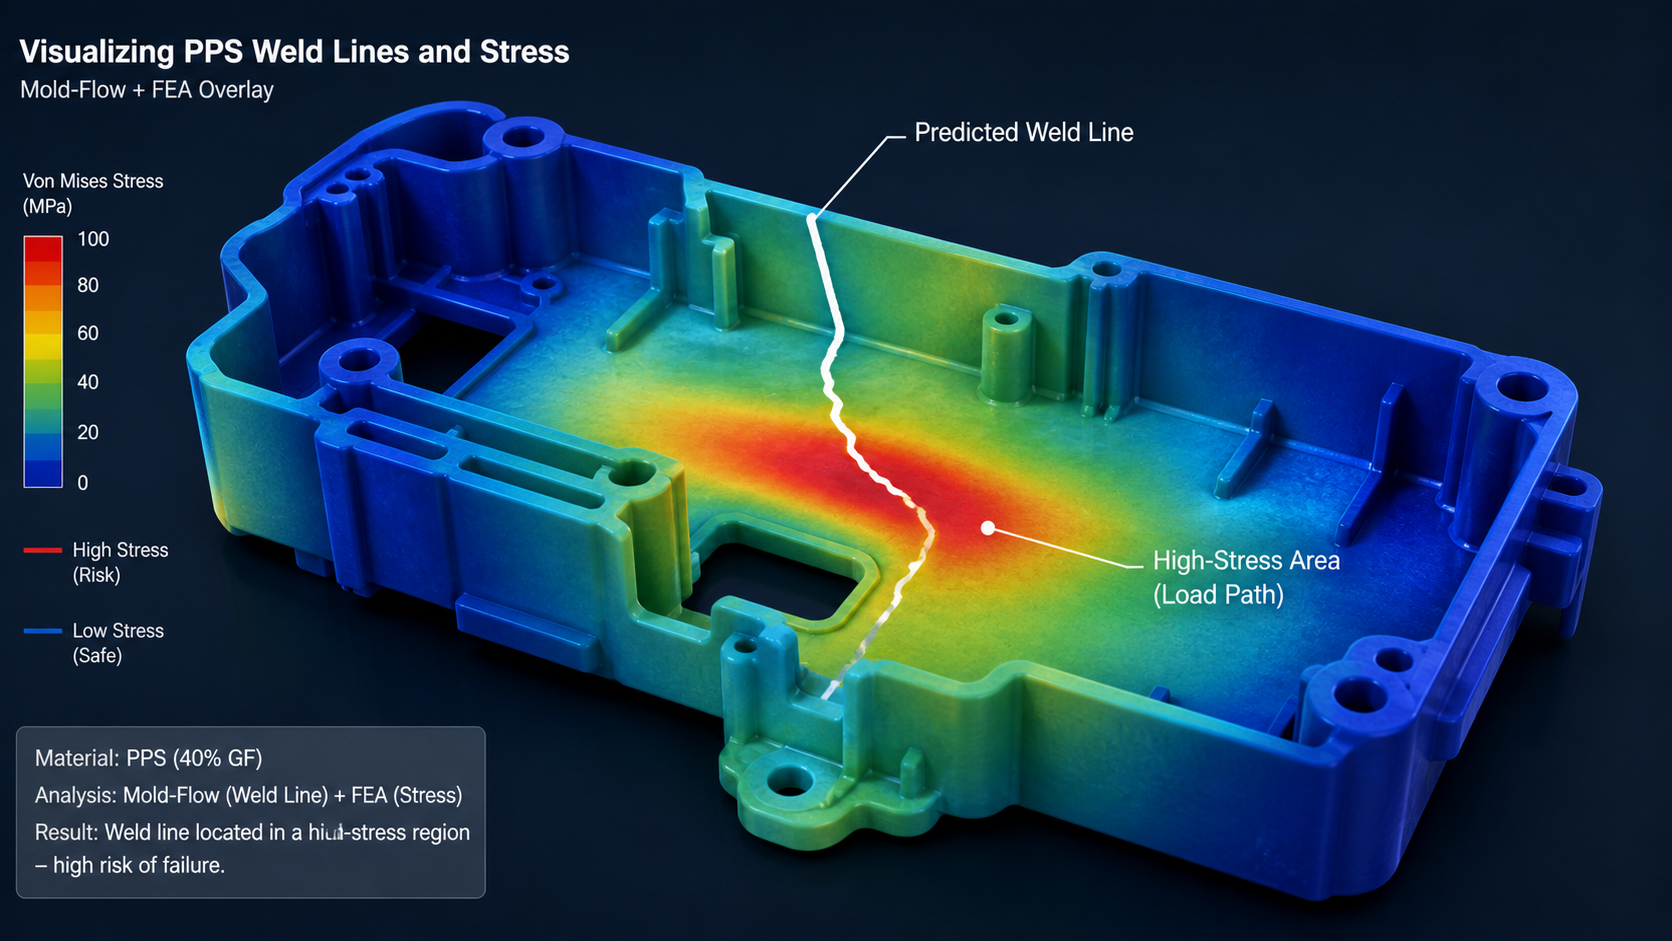
I've seen many projects where a part's performance depends heavily on the strength of a weld line. Polyphenylene sulfide (PPS) is a fantastic material, known for its high strength and temperature resistance. But like any semi-crystalline polymer, its weld lines can be a point of weakness. The issue isn't the material itself, but how it's processed. The location of the injection gate determines where the melt fronts meet and form a weld. If that weld falls on a spot that takes a lot of stress, the part can fail unexpectedly. Making an evidence-based decision before cutting steel is the key. We don't need to guess; we can simulate and compare different options to find the most robust design. This process gives us confidence that the part will perform as expected in its real-world application.
Overlaying Predicted Weld Locations on the Load Path?
You've designed a critical PPS component meant to carry a load. But have you considered where the weld line will form? Ignoring this could be a critical design flaw.
We overlay the weld line prediction from a mold-flow simulation directly onto the stress map from a structural analysis (FEA). This visual check immediately tells us if the part's weakest point aligns with its most stressed area.
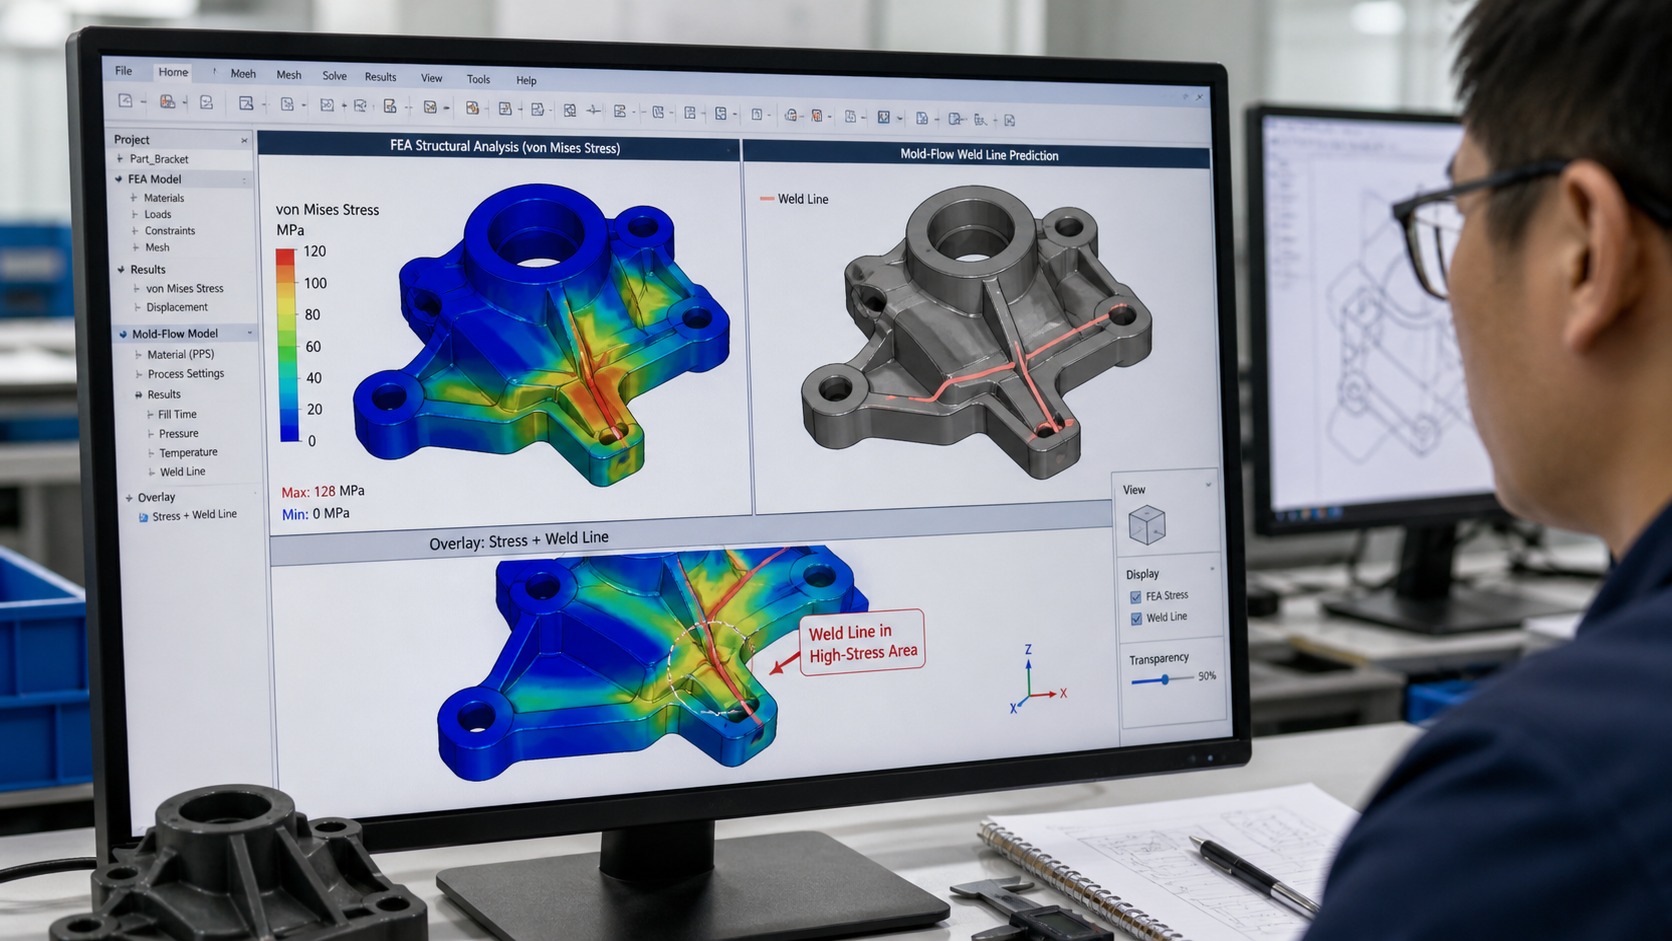
The first step in our process is always to understand the two key factors: where the stress is and where the weld will be. We assess PPS weld strength by looking at a combination of adhesion, molecular orientation, and stress concentration. We start by using Finite Element Analysis (FEA) to simulate how the part will behave under its normal operating loads. This gives us a color-coded map of stress across the entire part. The red areas show high stress, and the blue areas show low stress. This map defines the critical load path. Then, we use a separate mold-flow simulation to predict how the molten PPS will fill the tool cavity. This simulation shows us exactly where the melt fronts will meet and form a weld line. The real insight comes when we put these two pictures together.
The Two-Pronged Analysis
We look at the problem from both a mechanical and a processing perspective. One without the other gives an incomplete picture.
| Analysis Type | What It Tells Us | Key Output |
|---|---|---|
| Finite Element Analysis (FEA) | Identifies where the mechanical stress is highest when the part is in use. | A visual stress map of the component’s load path. |
| Mold-Flow Analysis | Predicts how the plastic will flow into the mold and where weld lines will form. | A simulation showing the exact location of predicted weld lines. |
By overlaying the mold-flow result on the FEA map, we can see if there is a dangerous overlap. It is a simple but powerful check that avoids guesswork.
Comparing Gate Options Before Cutting the Tool?
Injection molding tools are expensive and time-consuming to build. Making a mistake with gate location can lead to costly rework or, worse, a failed part in the field.
Before any steel is cut, we use mold-flow software to simulate several different gate location strategies. We compare how each option moves the weld line and affects overall part quality, ensuring an evidence-based decision.
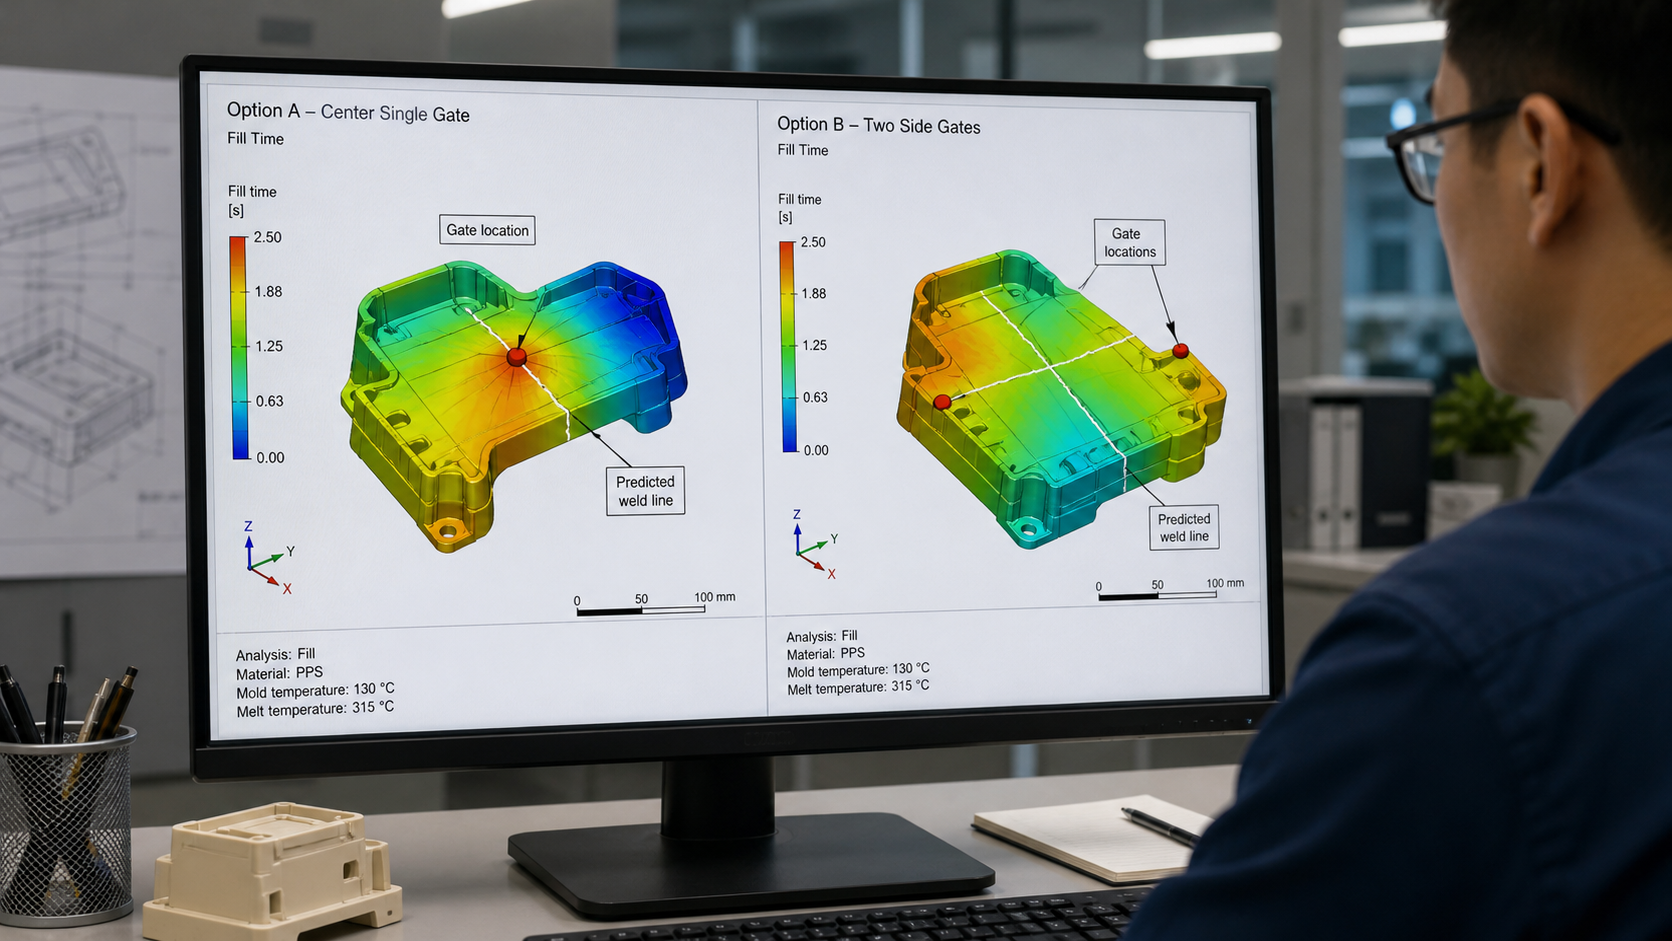
Once we know where the high-stress areas are, the next logical step is to find a gating strategy that moves the weld line away from them. This is where simulation becomes incredibly valuable. We can test multiple ideas virtually without any cost or risk. For example, I remember a project with a complex housing that had a critical snap-fit feature. The initial single-gate design placed the weld line right across the base of the snap-fit, the point of maximum stress during assembly. The simulation predicted it would fail. We then simulated a two-gate option. This moved the melt-front meeting point to a flat, non-critical face of the housing. The stress in that new area was minimal. We presented both simulations to the customer. The visual evidence made the decision easy. They approved the two-gate design, and we avoided a tool modification that would have cost thousands and delayed the project by weeks. This is what we mean by making tool design an evidence-based decision rather than relying only on a polymer name.
Checking Whether the Weld Moves Away From Peak Stress?
You've run a new simulation and moved the weld line. But is the new location truly safe? Just moving it is not enough; we need to confirm it moved to a low-stress zone.
The goal is to shift the weld line from a high-stress region to a low-stress one. We directly compare the stress value at the original weld location with the stress at the new, proposed location on the FEA map.
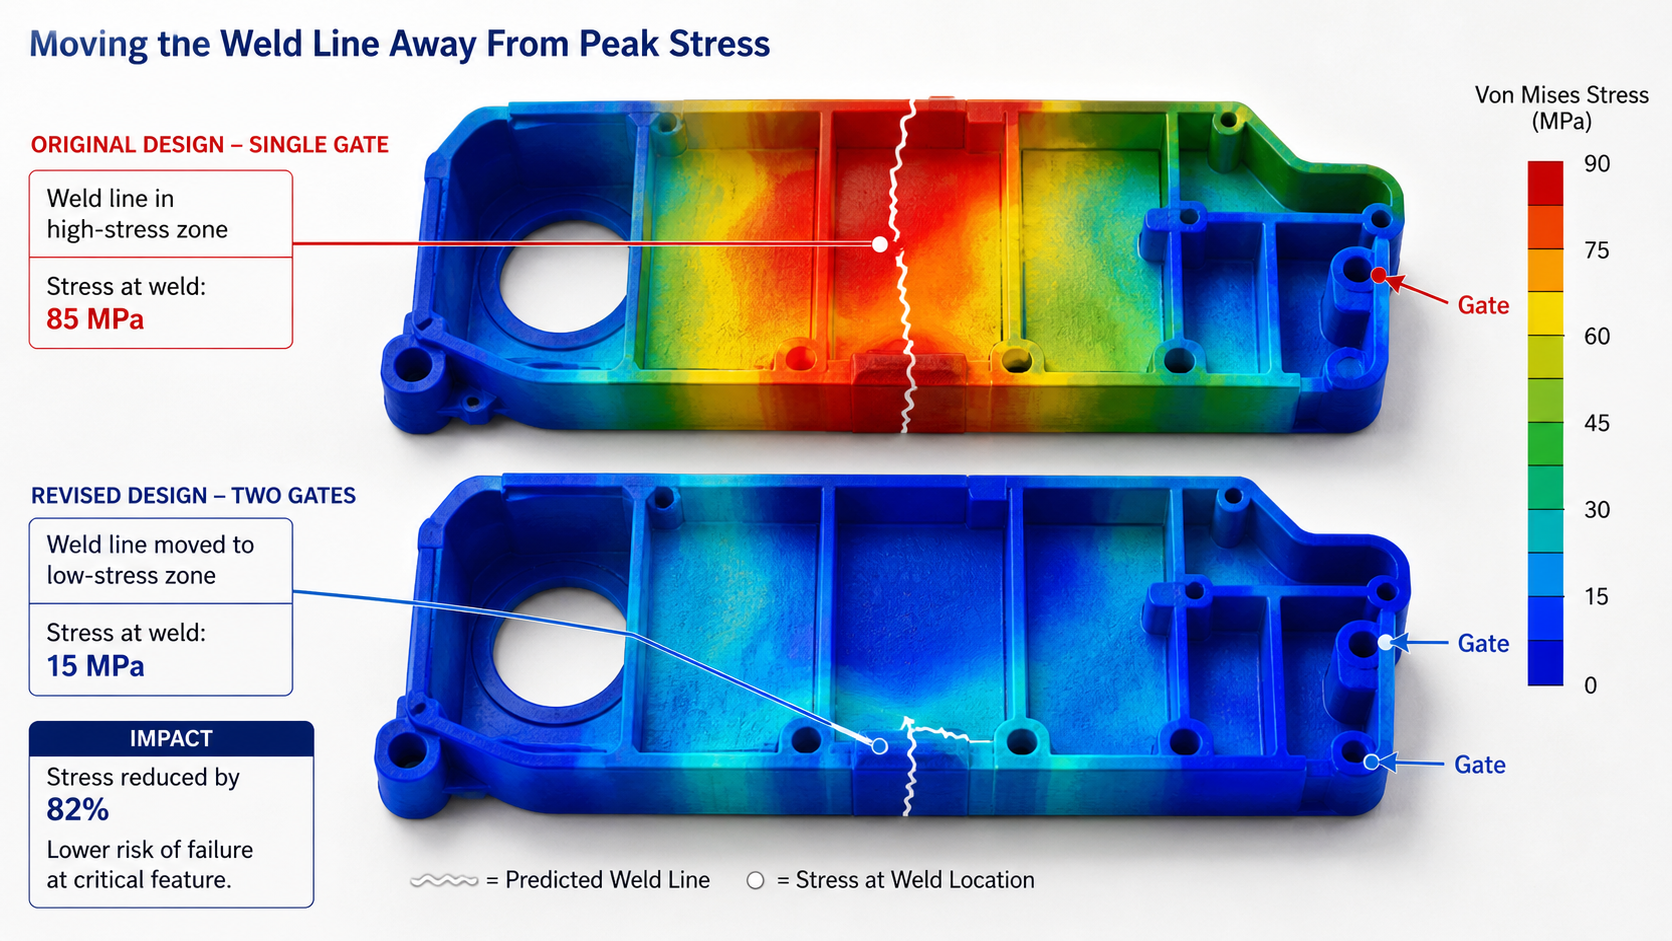
This step is about quantifying the improvement. It is not enough to just visually move the line. We have to check the numbers. In the snap-fit example I mentioned earlier, the original design placed the weld in an area with a predicted stress of 85 MPa. We know that the weld line strength of a reinforced PPS grade can be significantly lower than the base material strength, so this was a huge risk. Our revised two-gate design moved the weld line to a large, flat surface where the FEA model showed the stress was only 15 MPa. This was a reduction of over 80%. This simple check gives us a high degree of confidence that the new design will be robust. We also have to be careful that solving one problem doesn't create another.
Verifying the New Design
We always do a full review of the new simulation to ensure no new issues have been introduced. Moving a gate can change the filling pattern, potentially creating problems like gas traps or voids in other areas.
| Design Stage | Stress at Weld Line | Risk Assessment |
|---|---|---|
| Original (Single Gate) | 85 MPa | High risk of failure at a critical feature. |
| Revised (Two Gates) | 15 MPa | Low risk; weld is in a non-critical, low-stress area. |
The analysis must be holistic. We look at the fill time, pressure, and temperature distribution in the new design to make sure the part will still mold properly.
Confirming the Chosen Layout in Molded Parts?
A simulation is a powerful prediction, but it's not reality. How do we know the actual molded PPS part will behave exactly as the computer model suggested it would?
After the tool is built using the optimized gate layout, we mold physical parts. We then inspect these first articles to visually confirm the weld line location matches the simulation's prediction and perform tests if needed.
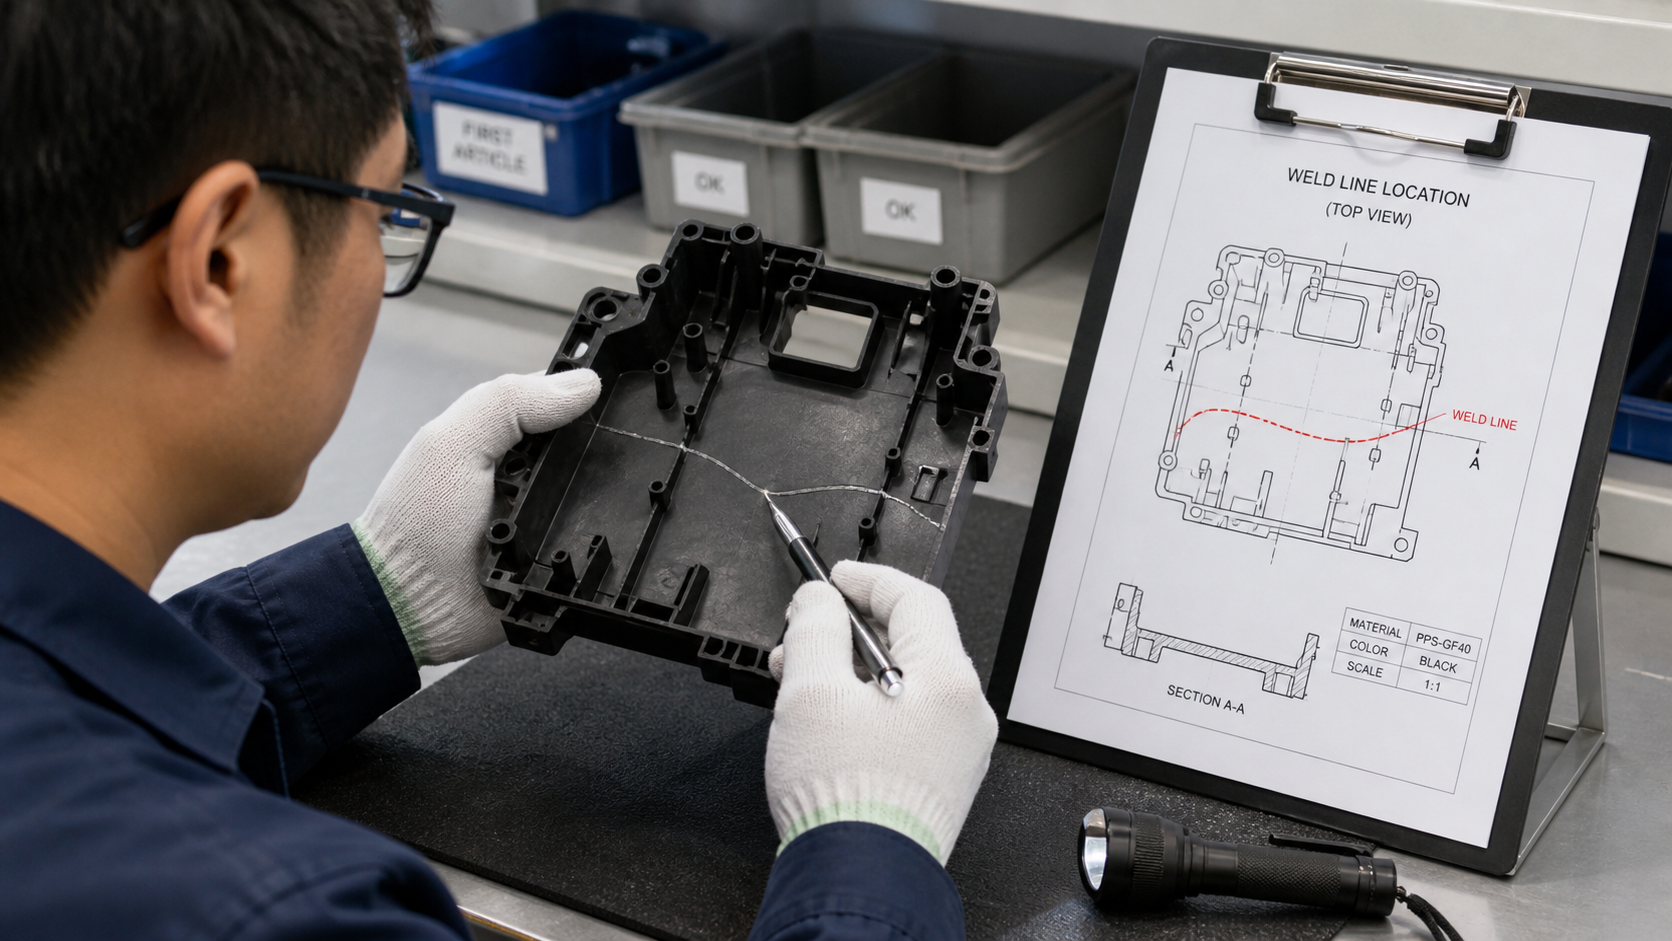
This is the final and most important step: closing the loop between the virtual world and the real world. Once we get the first parts from the new tool, our first action is to find the weld line. Sometimes it's easy to see with the naked eye, especially on a glossy part. Other times, we might need specific lighting or even break the part to see where the fracture begins. This confirms that our simulation accurately predicted the polymer flow. I worked on one part where the weld line was perfectly hidden in the final assembly. We had to mold parts in a natural color just to see it clearly for verification. Once we confirm the location, we can move on to mechanical testing. We retain the original material grade, test conditions, and application limits defined by the customer. It's important to state that we do not present this as our own test evidence; it is a collaborative process to confirm the design works for their specific application and material batch.
From Simulation to Reality
This final check validates the entire engineering process and provides tangible proof that the design is sound.
| Verification Step | Method | Purpose |
|---|---|---|
| Simulation | Mold-flow and FEA analysis. | To predict and optimize weld line location before tool manufacturing. |
| Physical Part | Visual inspection and/or mechanical testing of molded samples. | To confirm the simulation was accurate and the part meets strength requirements. |
This final confirmation is what gives everyone—from the designer to the end-user—confidence in the component's long-term performance and reliability.
Conclusion
In short, we use simulation to guide gate placement, moving weld lines away from high-stress areas. We then verify this with physical parts, ensuring strong, reliable PPS components.